Oslandia has been working for some years on open source tools dedicated to the visualization and prospective study of geological data.
This article is an overview of these achievements, mainly carried out on behalf of ORANO and CEA.
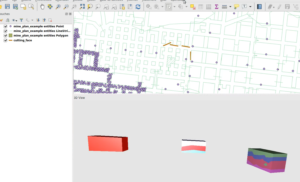
Albion : underground modeling
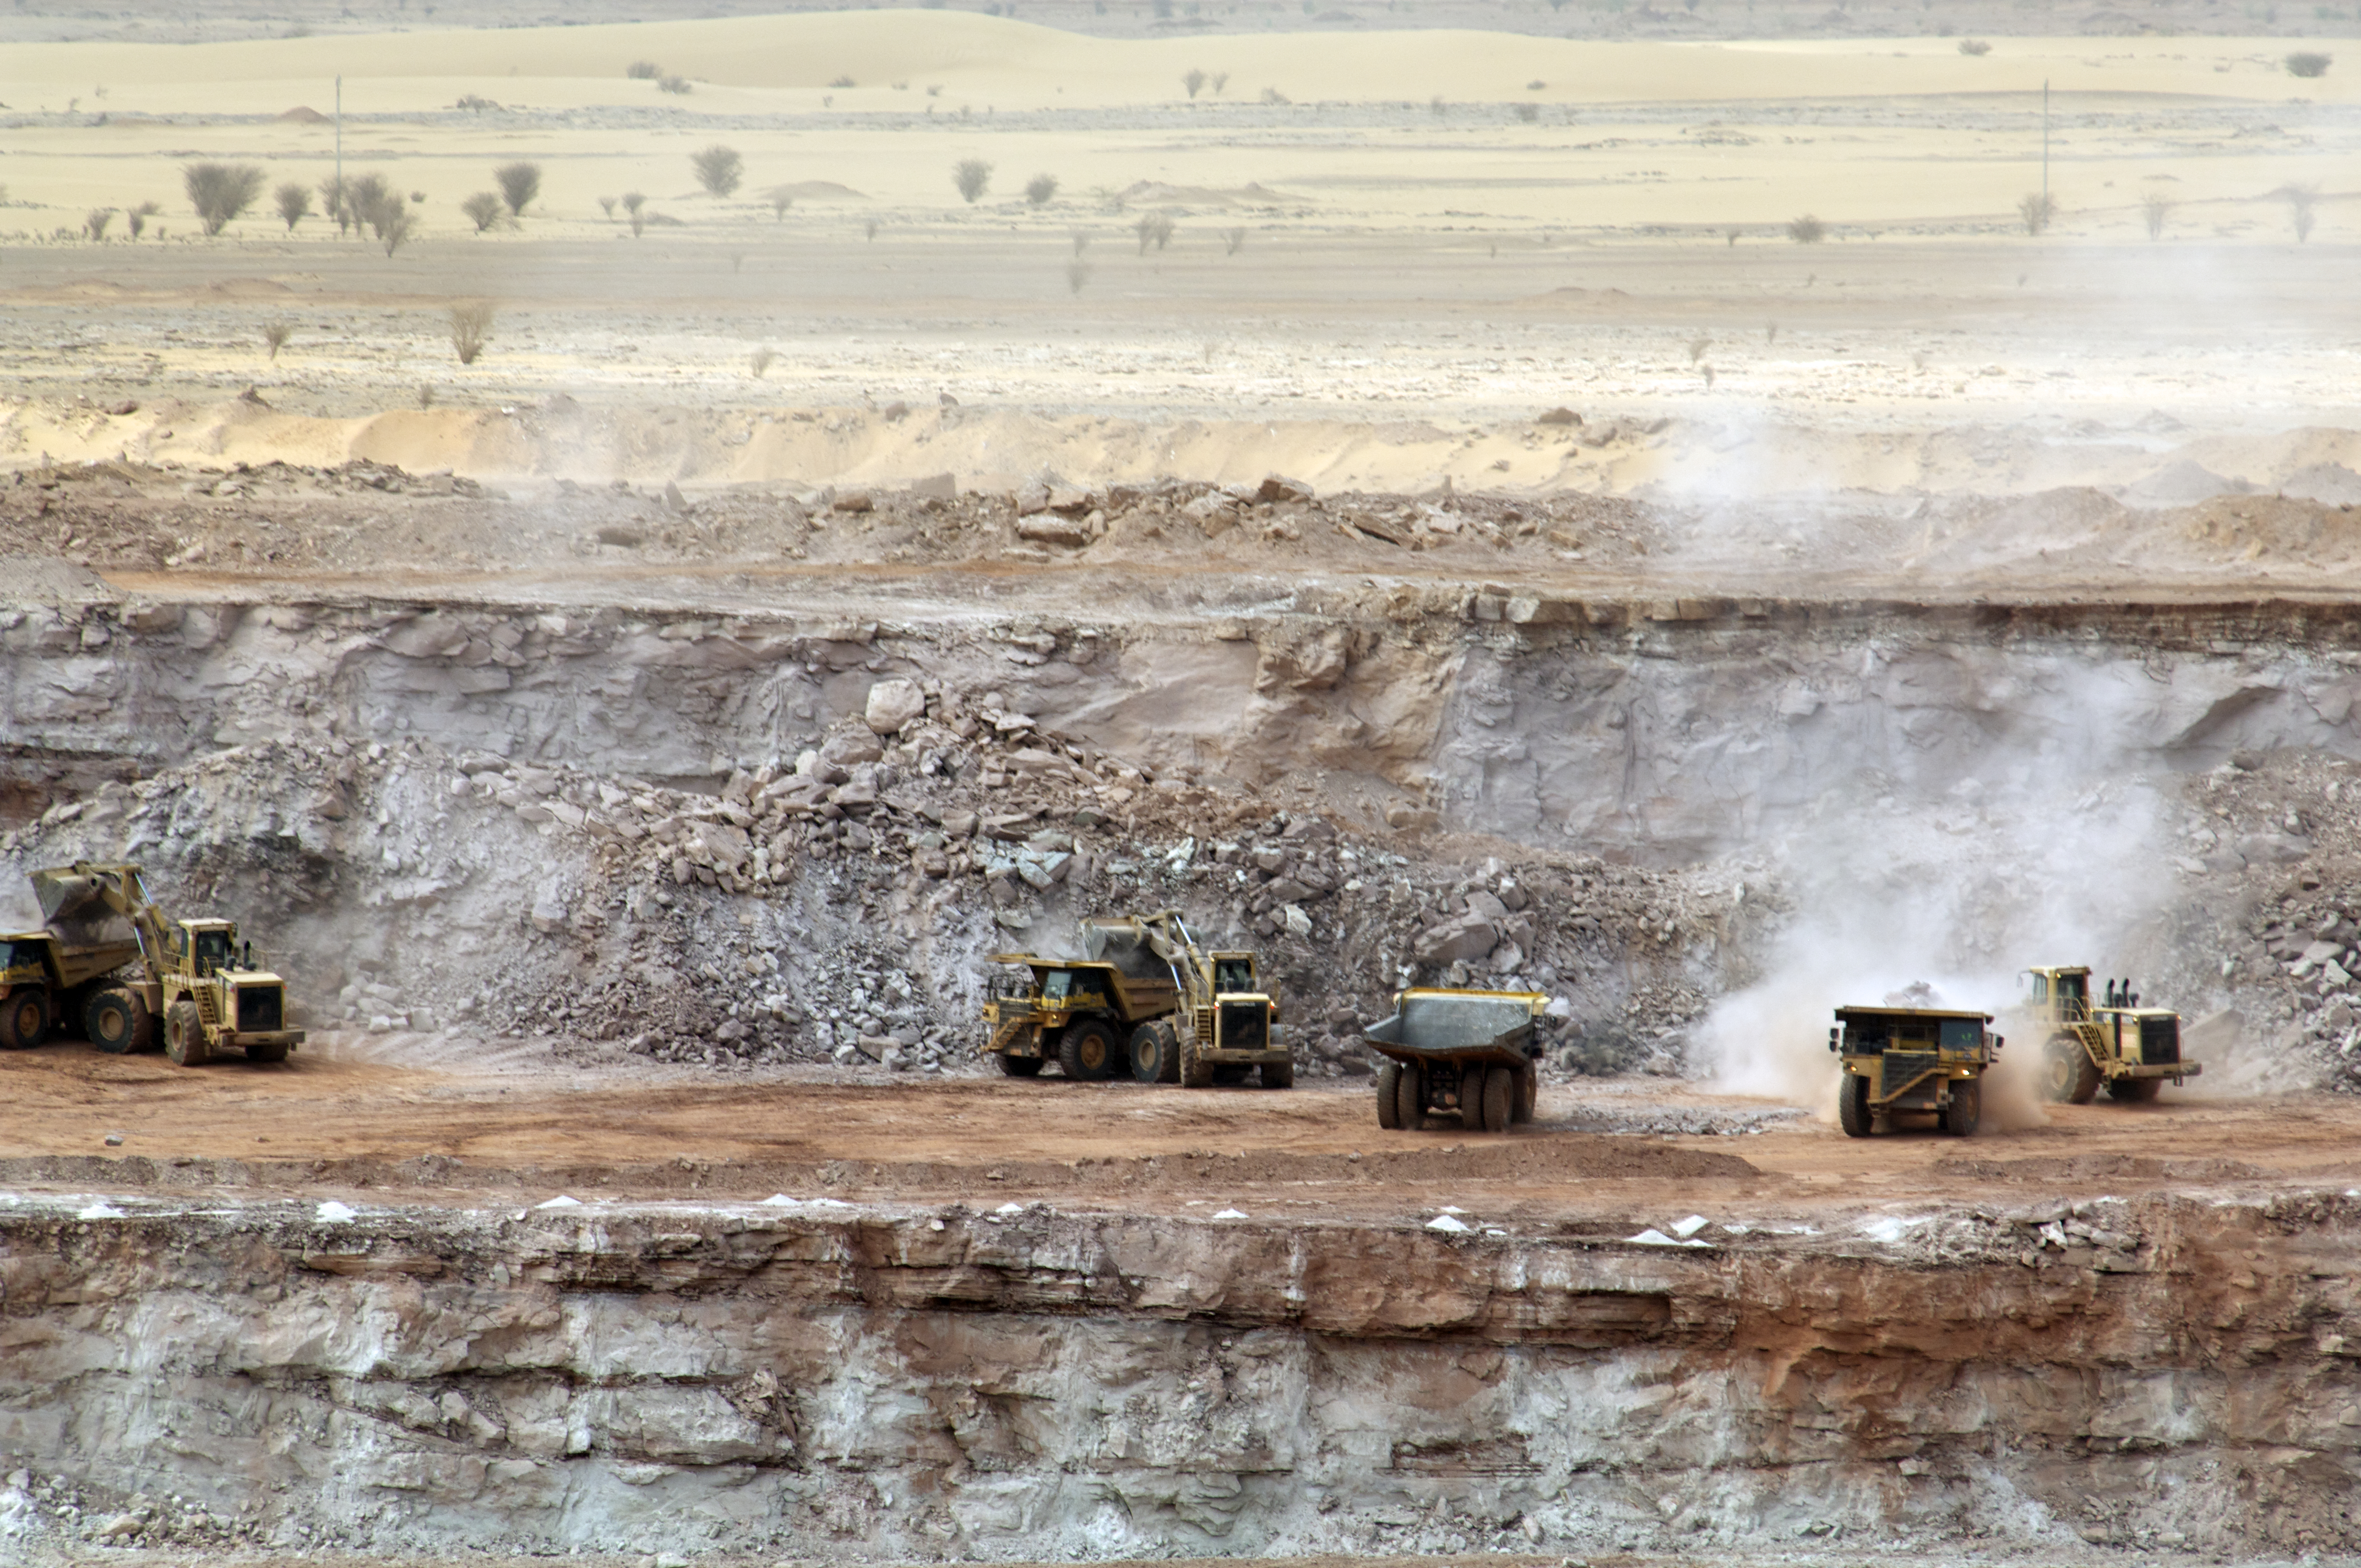
One of the upstream phases of the mining industry is to carry out series of drillings on the prospective site in order to find out the composition of the subsoil and to identify the places where it will be interesting to dig to exploit an ore. In this exploratory phase, the drillings follow one another and their density increases in the zones where the sought-after ore is detected.
The content of the boreholes is analyzed and the results are studied by geologists who will model the subsoil. This modelling was historically done by hand, and various modelling software was then adopted by the specialists in order to optimise their operations. Despite this software assistance, the work of modelling underground volumes is very time-consuming.

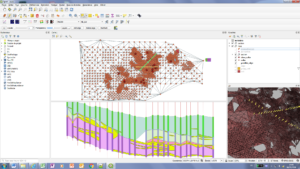
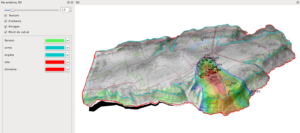
Albion is a fully open source software, built to meet this productivity constraint : it uses a Delaunay triangulation to put the boreholes in relation to each other in order to correlate the information carried by each of them. Once the triangulation is defined, the operator can use it to envisage virtual “cut faces” and imagine volumes : they can refine the underground modeling, block after block. This progressive visualization in 3D allows a fine understanding of the decomposition of underground.
We advise to watch Vincent Mora’s lecture on this subject, which clearly shows the link between the data extracted from logs, the operational objectives in a mining context, and the uses made of it with Albion.
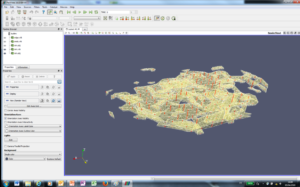
Albion also includes automation tools to speed up processing time. This acceleration of the production, thanks to the use of Albion, represents at least a 10 factor. Ultimately, Albion makes it possible to manipulate, explore and export (for other uses) a complete geological model.

Thus, Albion automates the correlation between objects identified on each borehole, and allows to build a 3D digital model, visualizable in QGIS and exportable in an interoperable format:
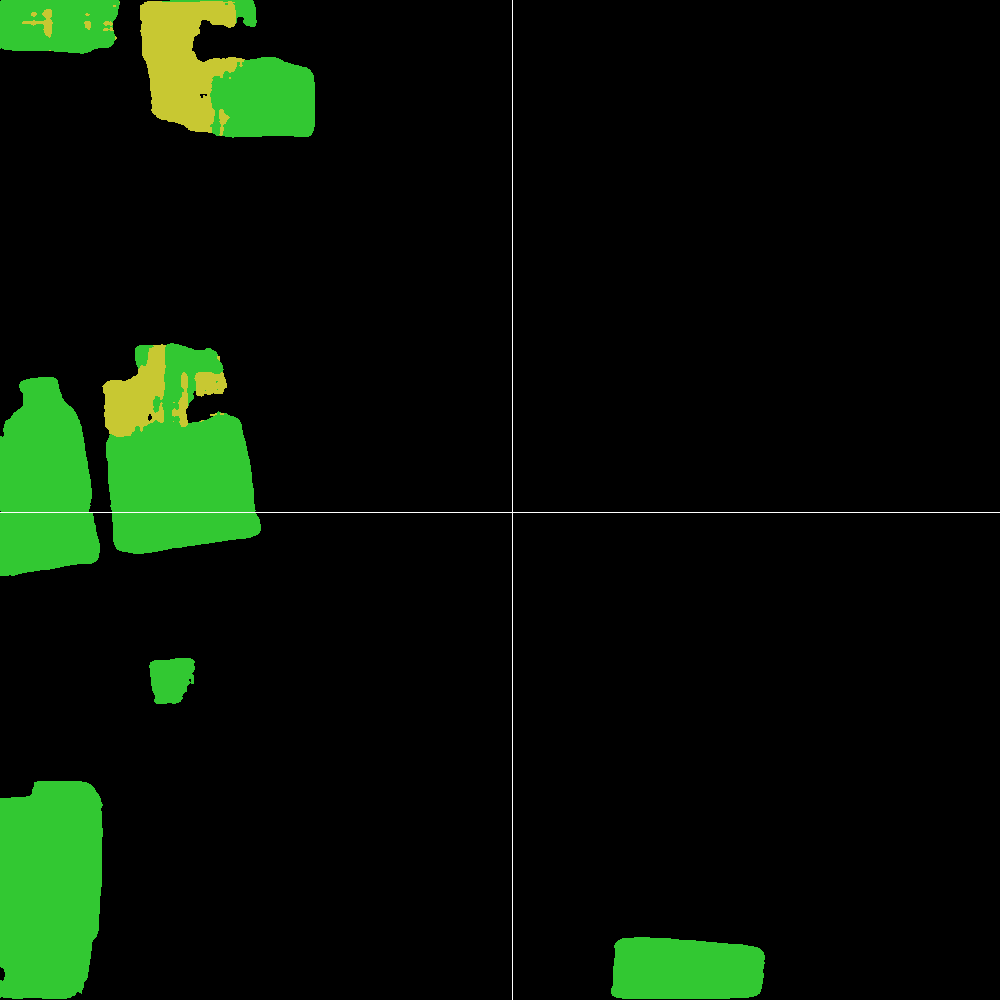
CrtlCraft : precise location in mining environment
In a previous article we mentioned hardware for mine operators: one of the objectives of the CtrlCraft project is to limit the movement of dumper (industrial trucks) that have to move in order to measure the radiometry of the ore.
The CAN-OP probe makes it possible to perform this measurement directly in the field : the results are processed by the CtrlCraft tool. The application compiles and presents an evolving view of the mine bottom. Each block has an estimated radiometry :
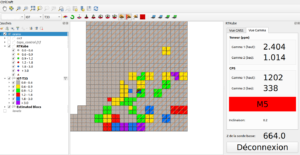
CtrlCraft thus participates in a better consideration of the nature of the materials to optimize the wear of the rolling stock.
OpenStope for drawing the walls
CtrlCraft, described above, is used in open mine. Methods and tools are different in underground mines, where geologists make visual surveys of the faces to guide exploration. The goal of OpenStope is to replace the geologist’s sketchbook to provide more functionality.
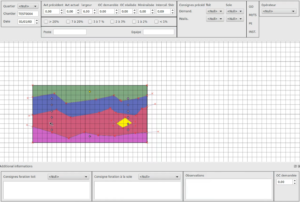
The QGIS interface has been modified to make the geologists’ drawing operations as simple as possible. The drawing is therefore reduced to its simplest expression. BUT the information entered gives rise to a high added value exploitation, by allowing the construction of partial geological models linked to the mine map :
Thyrsis: hydrogeological simulation
Thyrsis has been developed on behalf of the CEA to visually exploit an underground diffusion calculation code. The application has recently been modified to work with OpenFOAM in order to facilitate its use by other users ; a public release of the project is planned in 2020.
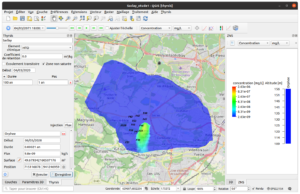
The application built with QGIS allows to pre-process the data, to launch the calculation and visualize the results, including on a 3D model :
QGeoloGIS : logs vizualisation
For many underground data specialists, borehole logs can look something like this :
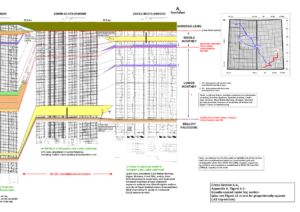
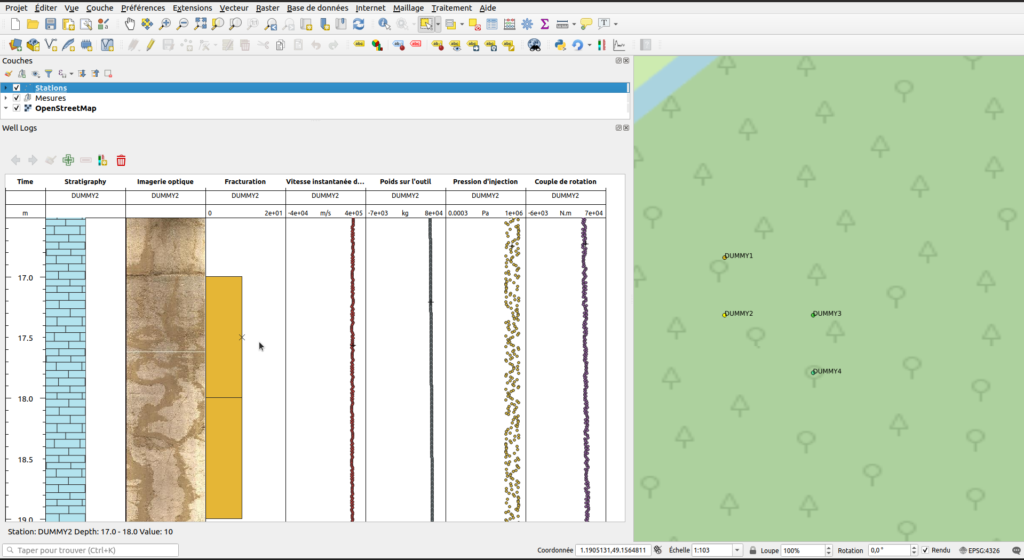
The tools developed for ORANO have found an echo among geologists, and in particular at CEA, which financed a generic QGIS plugin allowing users to read drilling log data natively. Thanks to these two funders, we published the QGeoloGIS plugin which is now accessible to all QGIS users !
QGeoloGIS uses the QGIS rendering engine to get a vertical visualization of point data :
The choice of elements displayed in the plugin is configurable. Moreover, not only geological data are concerned by its use : it can also display time series.
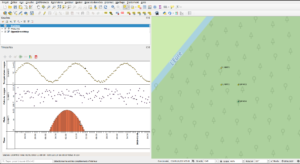
This example shows the versatility of the plugin: its flexibility was made possible thanks to its modular design and to the flexibility allowed by the use of the QGIS rendering engine.