Context
We mentioned this in a previous article: the Canadian Space Agency (CSA) is supporting flights of open stratospheric balloons (OSBs), operated on Canadian soil by CNES. Some of these balloons fly at an altitude of around 40 km in conditions close to the space environment, others fly lower in the atmosphere, and all carry a large number of measuring and observation instruments weighing up to 800 kg. Many organisations (laboratories, schools, industry, etc.) around the world use smaller balloons (such as weather sounders) to carry out experiments. As regulations for unmanned balloon flights are different in Canada, the CSA set out in 2018 to develop a platform to meet the requirements of their domestic flights. To track these balloons, their data is transmitted to an Iridium satellite, which sends it to a server on Earth, where it is retrieved.
This server receives around thirty variables, including location (lat, long), altitude, speed, atmospheric pressure, temperature, battery voltage and so on.
In our previous work, we built a proof of concept and, in consultation with the CSA, decided on a different way of representing the information, using an interface they had already developed. We transformed the interface used to view telemetry without the help of the CSA.
Fonctionnality
The plugin collects telemetry data. The first step is to retrieve the data and parse it: these are strings of characters to be separated according to a delimiter and specific lengths.
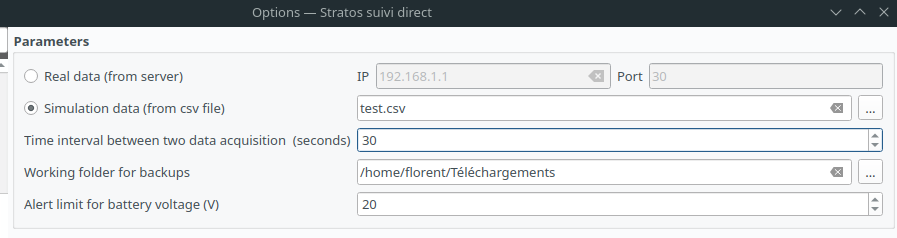
Two data acquisition modes are available:
- A real mode, where you need to enter the IP address and port of the server from which to retrieve the data
- A simulation mode, where you need to enter a CSV file containing data simulating a flight, or repeating previous flights
Acquisition can be paused and the interface reset.
Finally, in the parameters, you can enter an alert threshold for battery voltage, below which the user will be alerted :
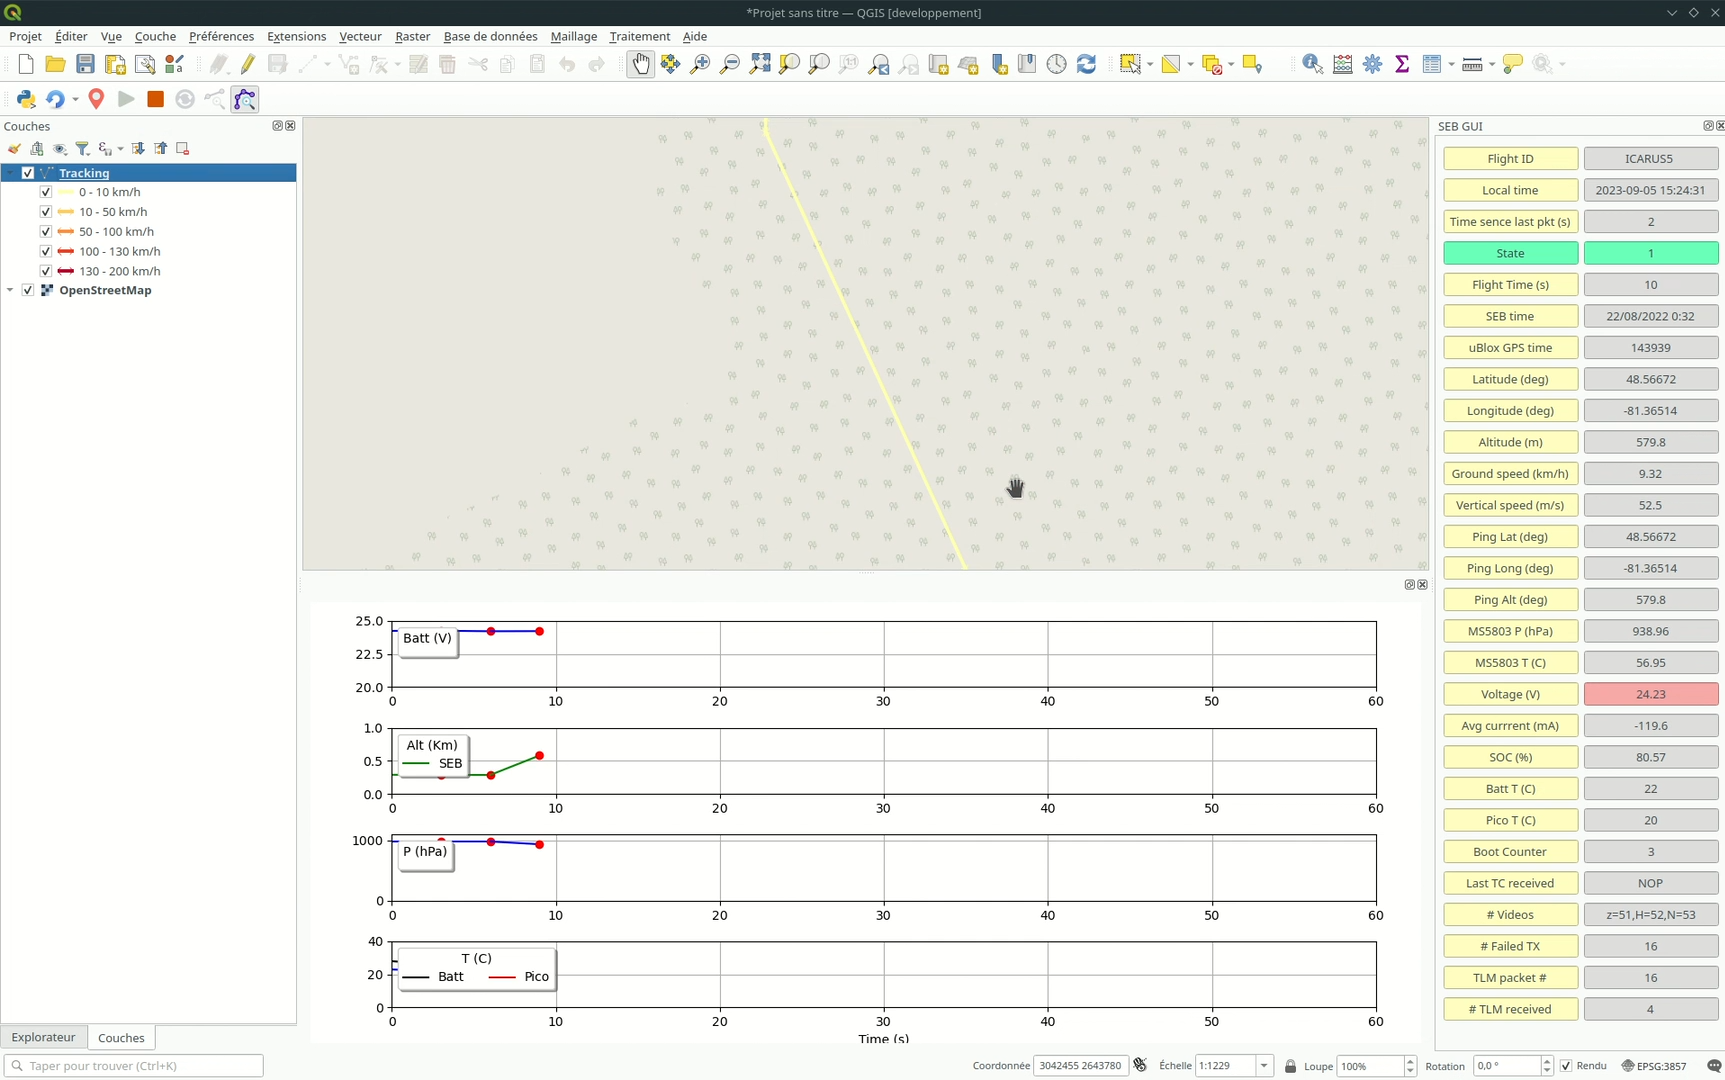
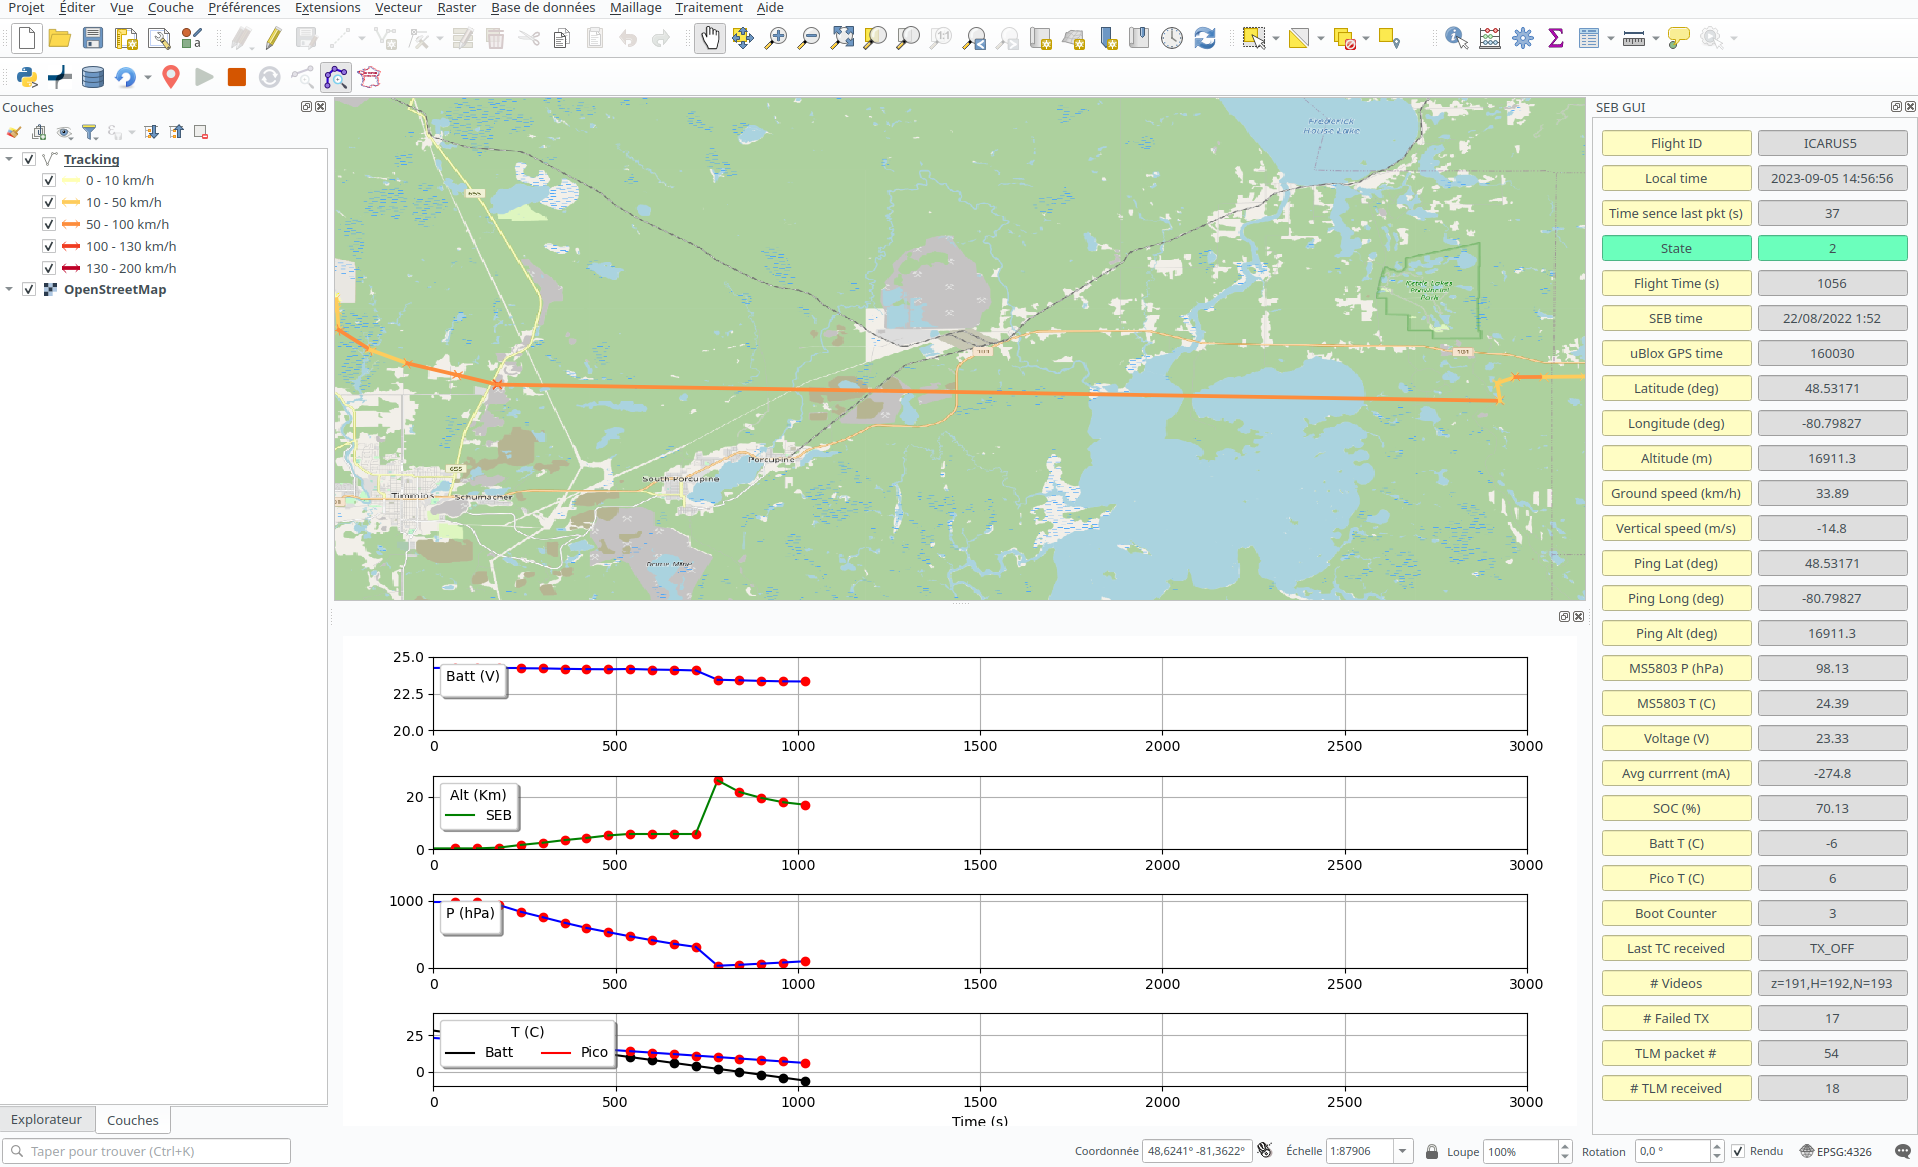
The acquired data are presented in 3 different zones in the QGIS interface:
- A column (right) listing all data collected
- A block (bottom) containing various curves (battery voltage, altitude, pressure and temperature)
- And the map showing the balloon’s route, with two zoom options:
- Zoom to last balloon position
- Zoom in on the entire track
Once acquisition is complete, the data is saved in the folder specified in the plugin parameters, shared in a CSV file for raw data, and in a Shapefile for geographic data..