![]()
Giro3D is a Javascript library for visualizing geospatial data on the Web. Used in particular by the Piero application, it is compatible with a wide range of raster and vector data sources, as well as 3D data such as point clouds.
- Official website: https: //giro3d.org
- Source code repository: https://gitlab.com/giro3d/giro3d
Version 0.35 brings a number of new features, including significant performance enhancements useful for complex scenes with numerous data sources.
Performance improvements
These improvements mainly concern the display of raster data (color or elevation) on the Map entity:
- Reduced memory usage of Map tiles
- Reduced image display latency on the Map
- Reduction in the number of HTTP requests made
- Increased tile processing speed
New features
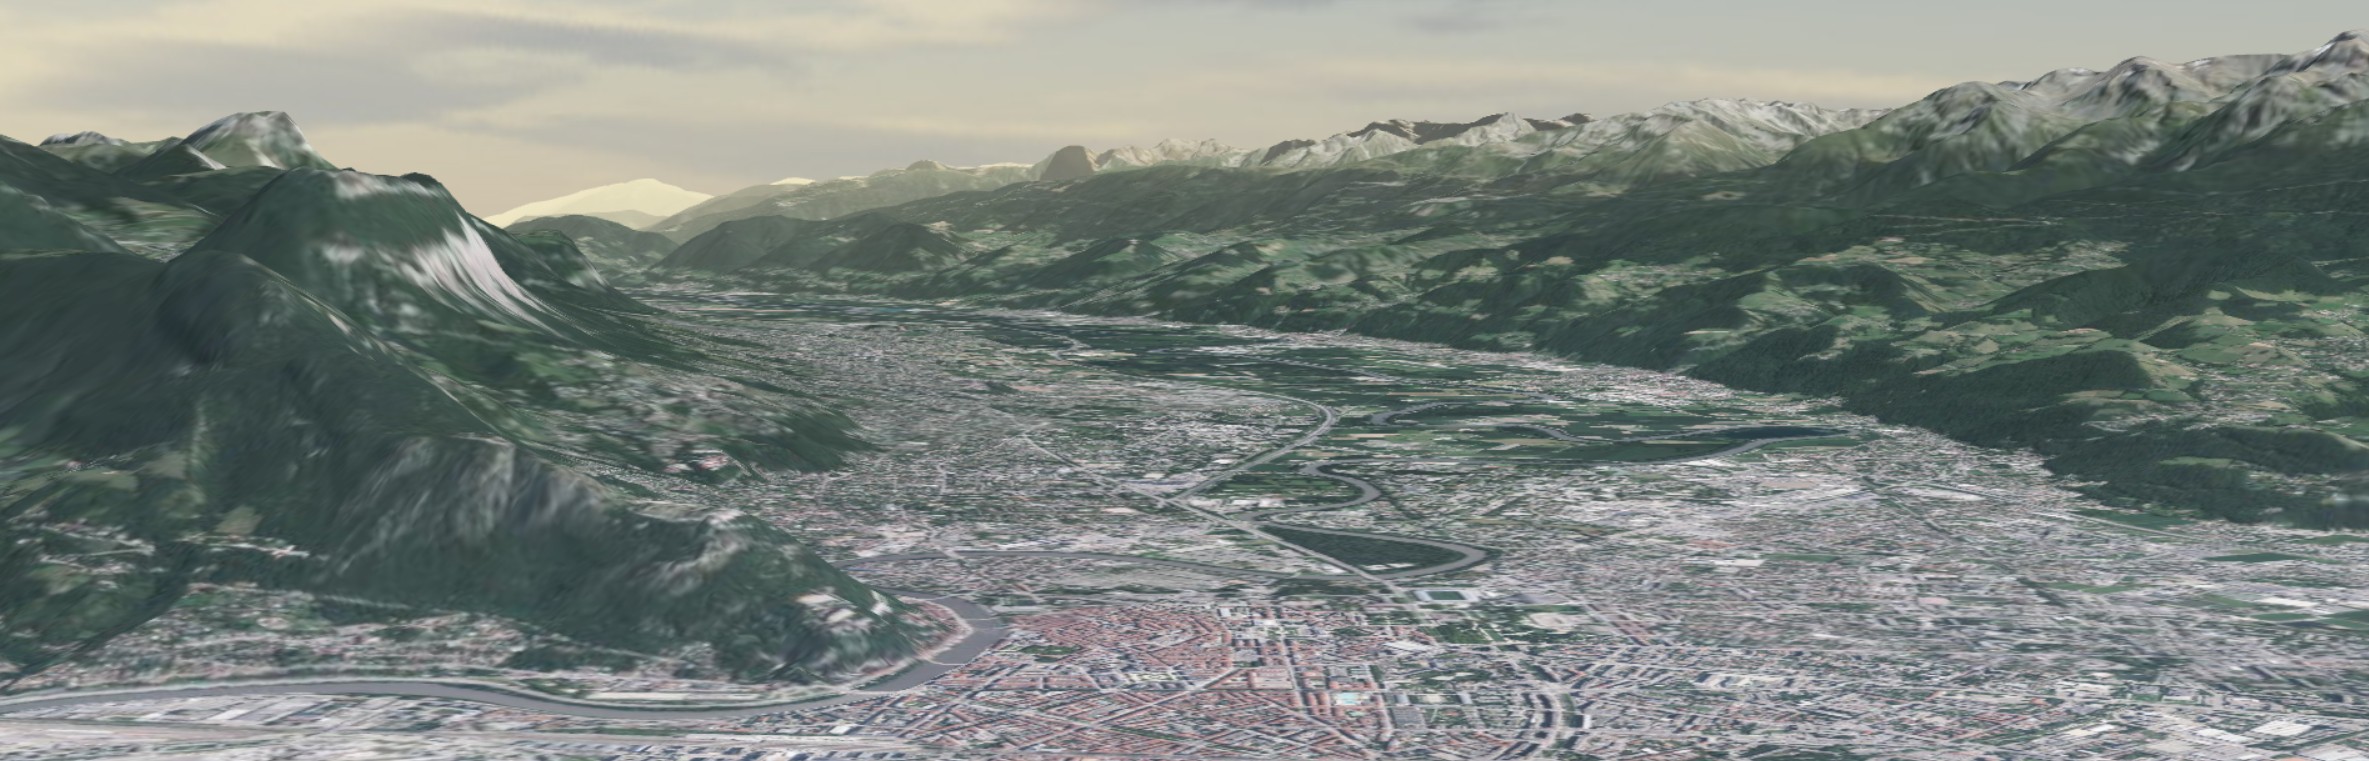
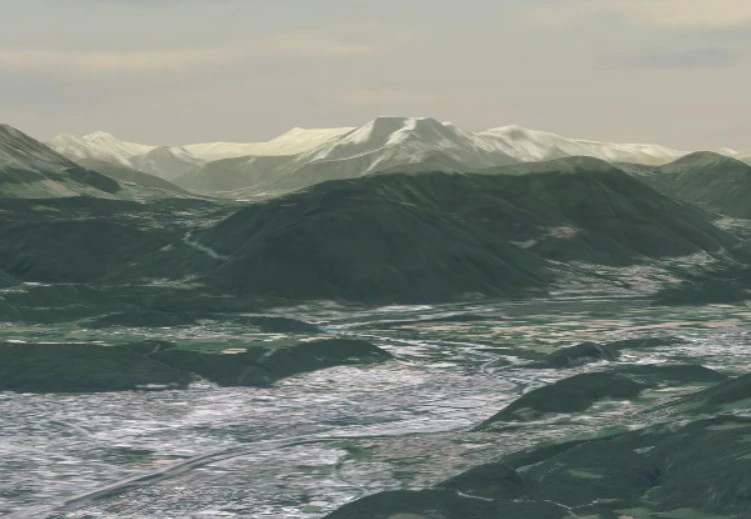
THREE.js fog support
👉 See the interactive example
Map entities and point clouds now support THREE.js fog, allowing you to add atmospheric effects to your scenes.
Fog in Giro3D
Geographic graticule
👉 See the dedicated example.
The Map entity can now display a fully customizable geographic graticule on its surface:
- X and Y pitch setting
- coordinate origin
- color
- opacity
- line thickness
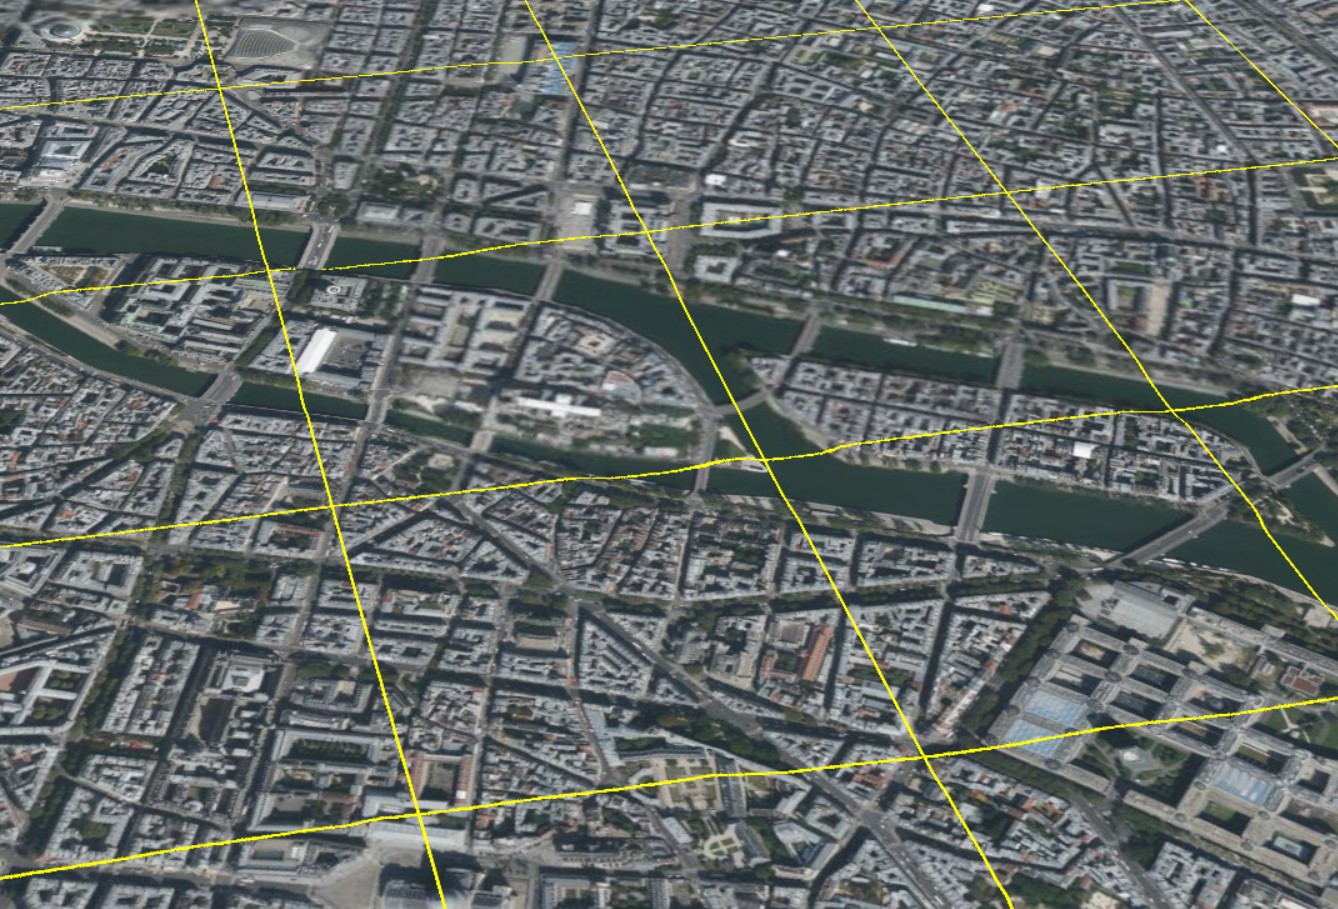
The graticule with a 500-meter step.
GeoTIFF YCbCr and transparency masks
👉 See the interactive example.
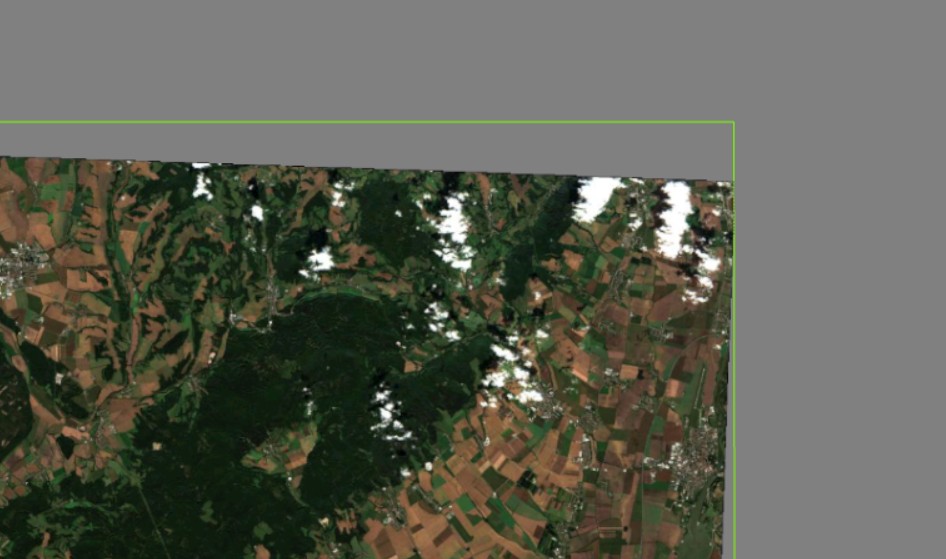
A JPEG-compressed GeoTIFF image, using the YCbCr color space and a transparency mask. The green border indicates the image boundary, and is not visible by default.