In a recent blog post, we talked about Oslandia’s works in geology, especially within the QGIS ecosystem. This new article will focus on one of the described tool: QGeoloGIS.
We recently released the 1.7.0 version for this QGIS plugin. Let’s describe some of its new features and recall what we can do with it!
QGeoloGIS, what is it?
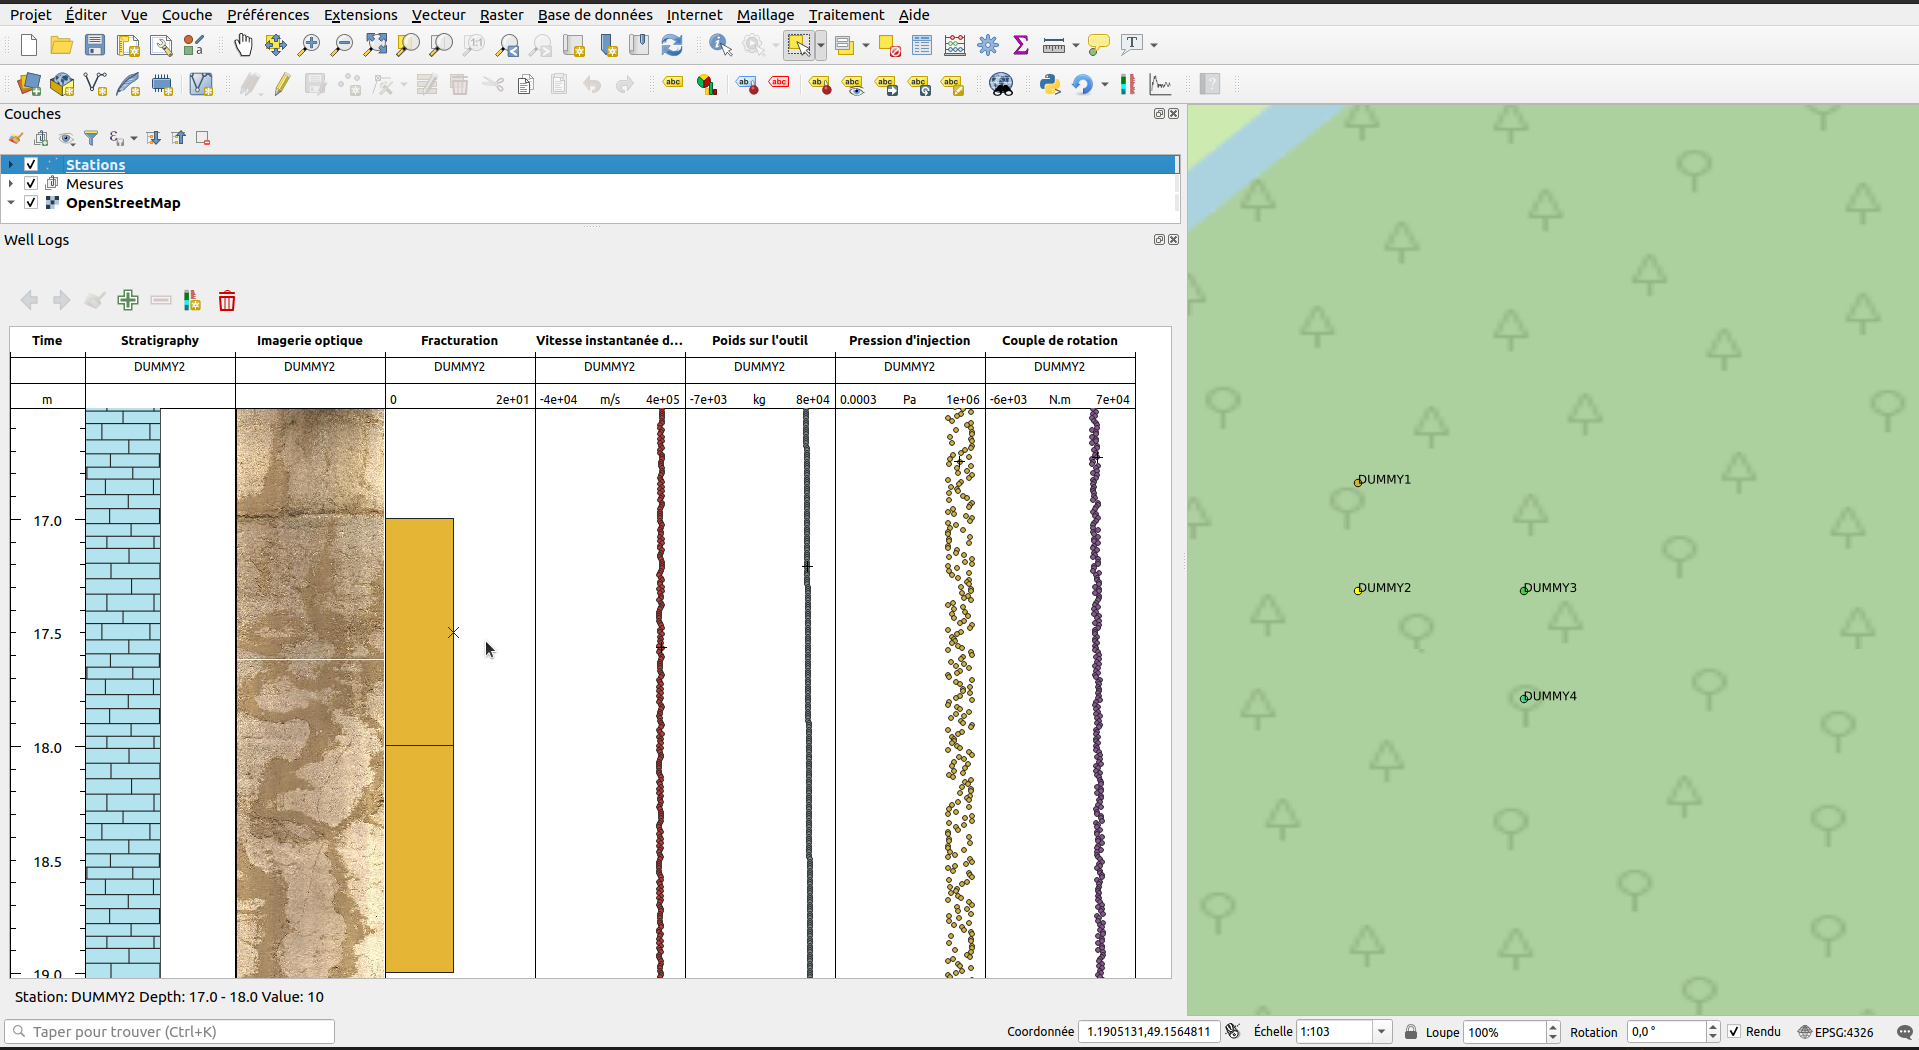
QGeoloGIS is a QGIS plugin that aims at visualizing well log dataseries, stratigraphy, imagery at each drilling site; it supports timeseries as well. The next figure shows which kinds of data it may depicts.
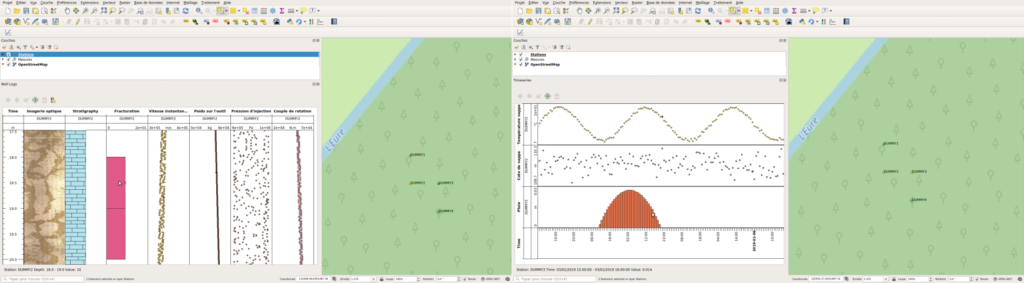
QGeoloGIS supported data (left: log dataseries; right: timeseries)
It is generic enough to be used in other contexts (archeology, civil engineering…), however the usecases it was designed for are focus on geology. Its main funders are the CEA (French Alternative Energies and Atomic Energy Commission) and Orano.
What’s new?
For the next months, a huge amount of work has been done to expand the plugin functional scope. Here comes the main evolutions…
- Let’s begin with the brand new documentation, with a tutorial for beginners! This documentation was written by exploiting a small sample dataset, which provides an insight of QGeoloGIS supported data.
- QGeoloGIS now supports interval plots, in addition to discrete measures.
- The plot panels (respectively for logs and timeseries) have been updated and properly dissociated, in association with a refactoring of the interactions with the plot configuration. The panel buttons act on both panels.
- There are new plot configuration features, like logarithmic scale, min/max settings, cell sizes, titles, unit management… It is now even possible to stack dataseries within the same graphical cell.
- The plot controls have been refactored, in order to improve the plugin ergonomy.
What if you test it on your own? We would love to hear from you about the new QGeoloGIS!
How to begin?
QGeoloGIS works with any georeferenced data, as it supports GeoPackage and data stored in database (or even shapefiles for simple tabular measures).
Suppose you have a bunch of data with some drilling sites, and subsequent measures (which are defined along the depth axis or along the time axis). First you have to import your stations and the measures of interest as distinct QGIS layers. Then QGeoloGIS takes advantage of the QGIS selection tool.
For such a new configured station layer, you will be able to add new plot configurations for each measure of interest, taking advantage of the plugin buttons.
The configuration associated to the drilling site layer contains every information of interest: the displaying option as well as symbology for each measure to plot. The configuration is serializable through the QGIS project, however the plugin menu proposes an option to save the configuration as a .json file.
QGeoloGIS Roadmap
The QGeoloGIS roadmap for the next months is available on our Gitlab. It contains some challenging features that are not on QGeoloGIS yet, however we could expect finding new interested funders (maybe you!) for:
- Updating the configuration management.
- Designing a cleaner sample dataset, with a default symbology.
- Improving performances (especially when plotting large dataseries with interval plot).
- Expanding the data stacking to stratigraphy and image plots.
- Introducing transects and layouts, in the drilling site selection process as well as in visualization.
- Editing data directly on the plot.
- Exporting plots through the map composer.
Do not hesitate to interact with us if you think about another exciting feature!
Next moves
In the next months, we plan to continue our efforts around the roadmap definition. This software will have a place of choice in our GIS for geology user club.
Are you interested in this topic? We will be pleased to discuss it with you, feel free to contact us at infos@oslandia.com!