Mining industry professionals are in natural need of solutions for drillhole visualization, management, and edition.
Although several free or Open Source solutions exist on the market to partially address the need, none has propagated into common use.
In partnership with a team of mining industry leaders, Oslandia intends to develop a high performance drillhole visualization QGIS module supporting 3D, cross-section, and log views.
Check Oslandia’s previous contribution to Open Source in Geology.
Source code

OpenLog is available in beta, try it out !
Project features
The operational goal is to provide a high performance, multi-view, multi-scale, editor/viewer for drillholes in QGIS.
Section viewer
- Log data colour mapped to drillhole trace.
-
Log data graph mapped alongside drillhole trace.
-
Support multiple DTM outlines.
-
Spatial gridding with geographical/local/projected coordinates.
-
Controls for labels, tags, and legends
-
Downhole structural data projection (apparent dips)
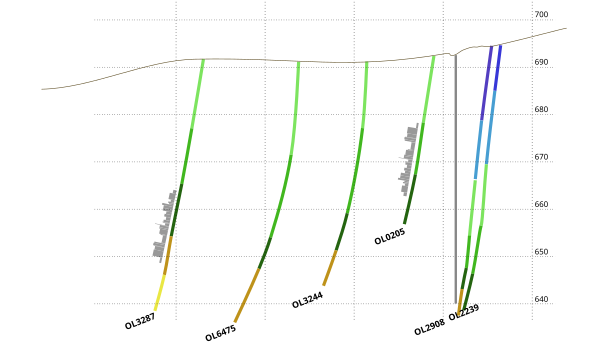
Cross section view examples with colour coded geology and graphed numerical data
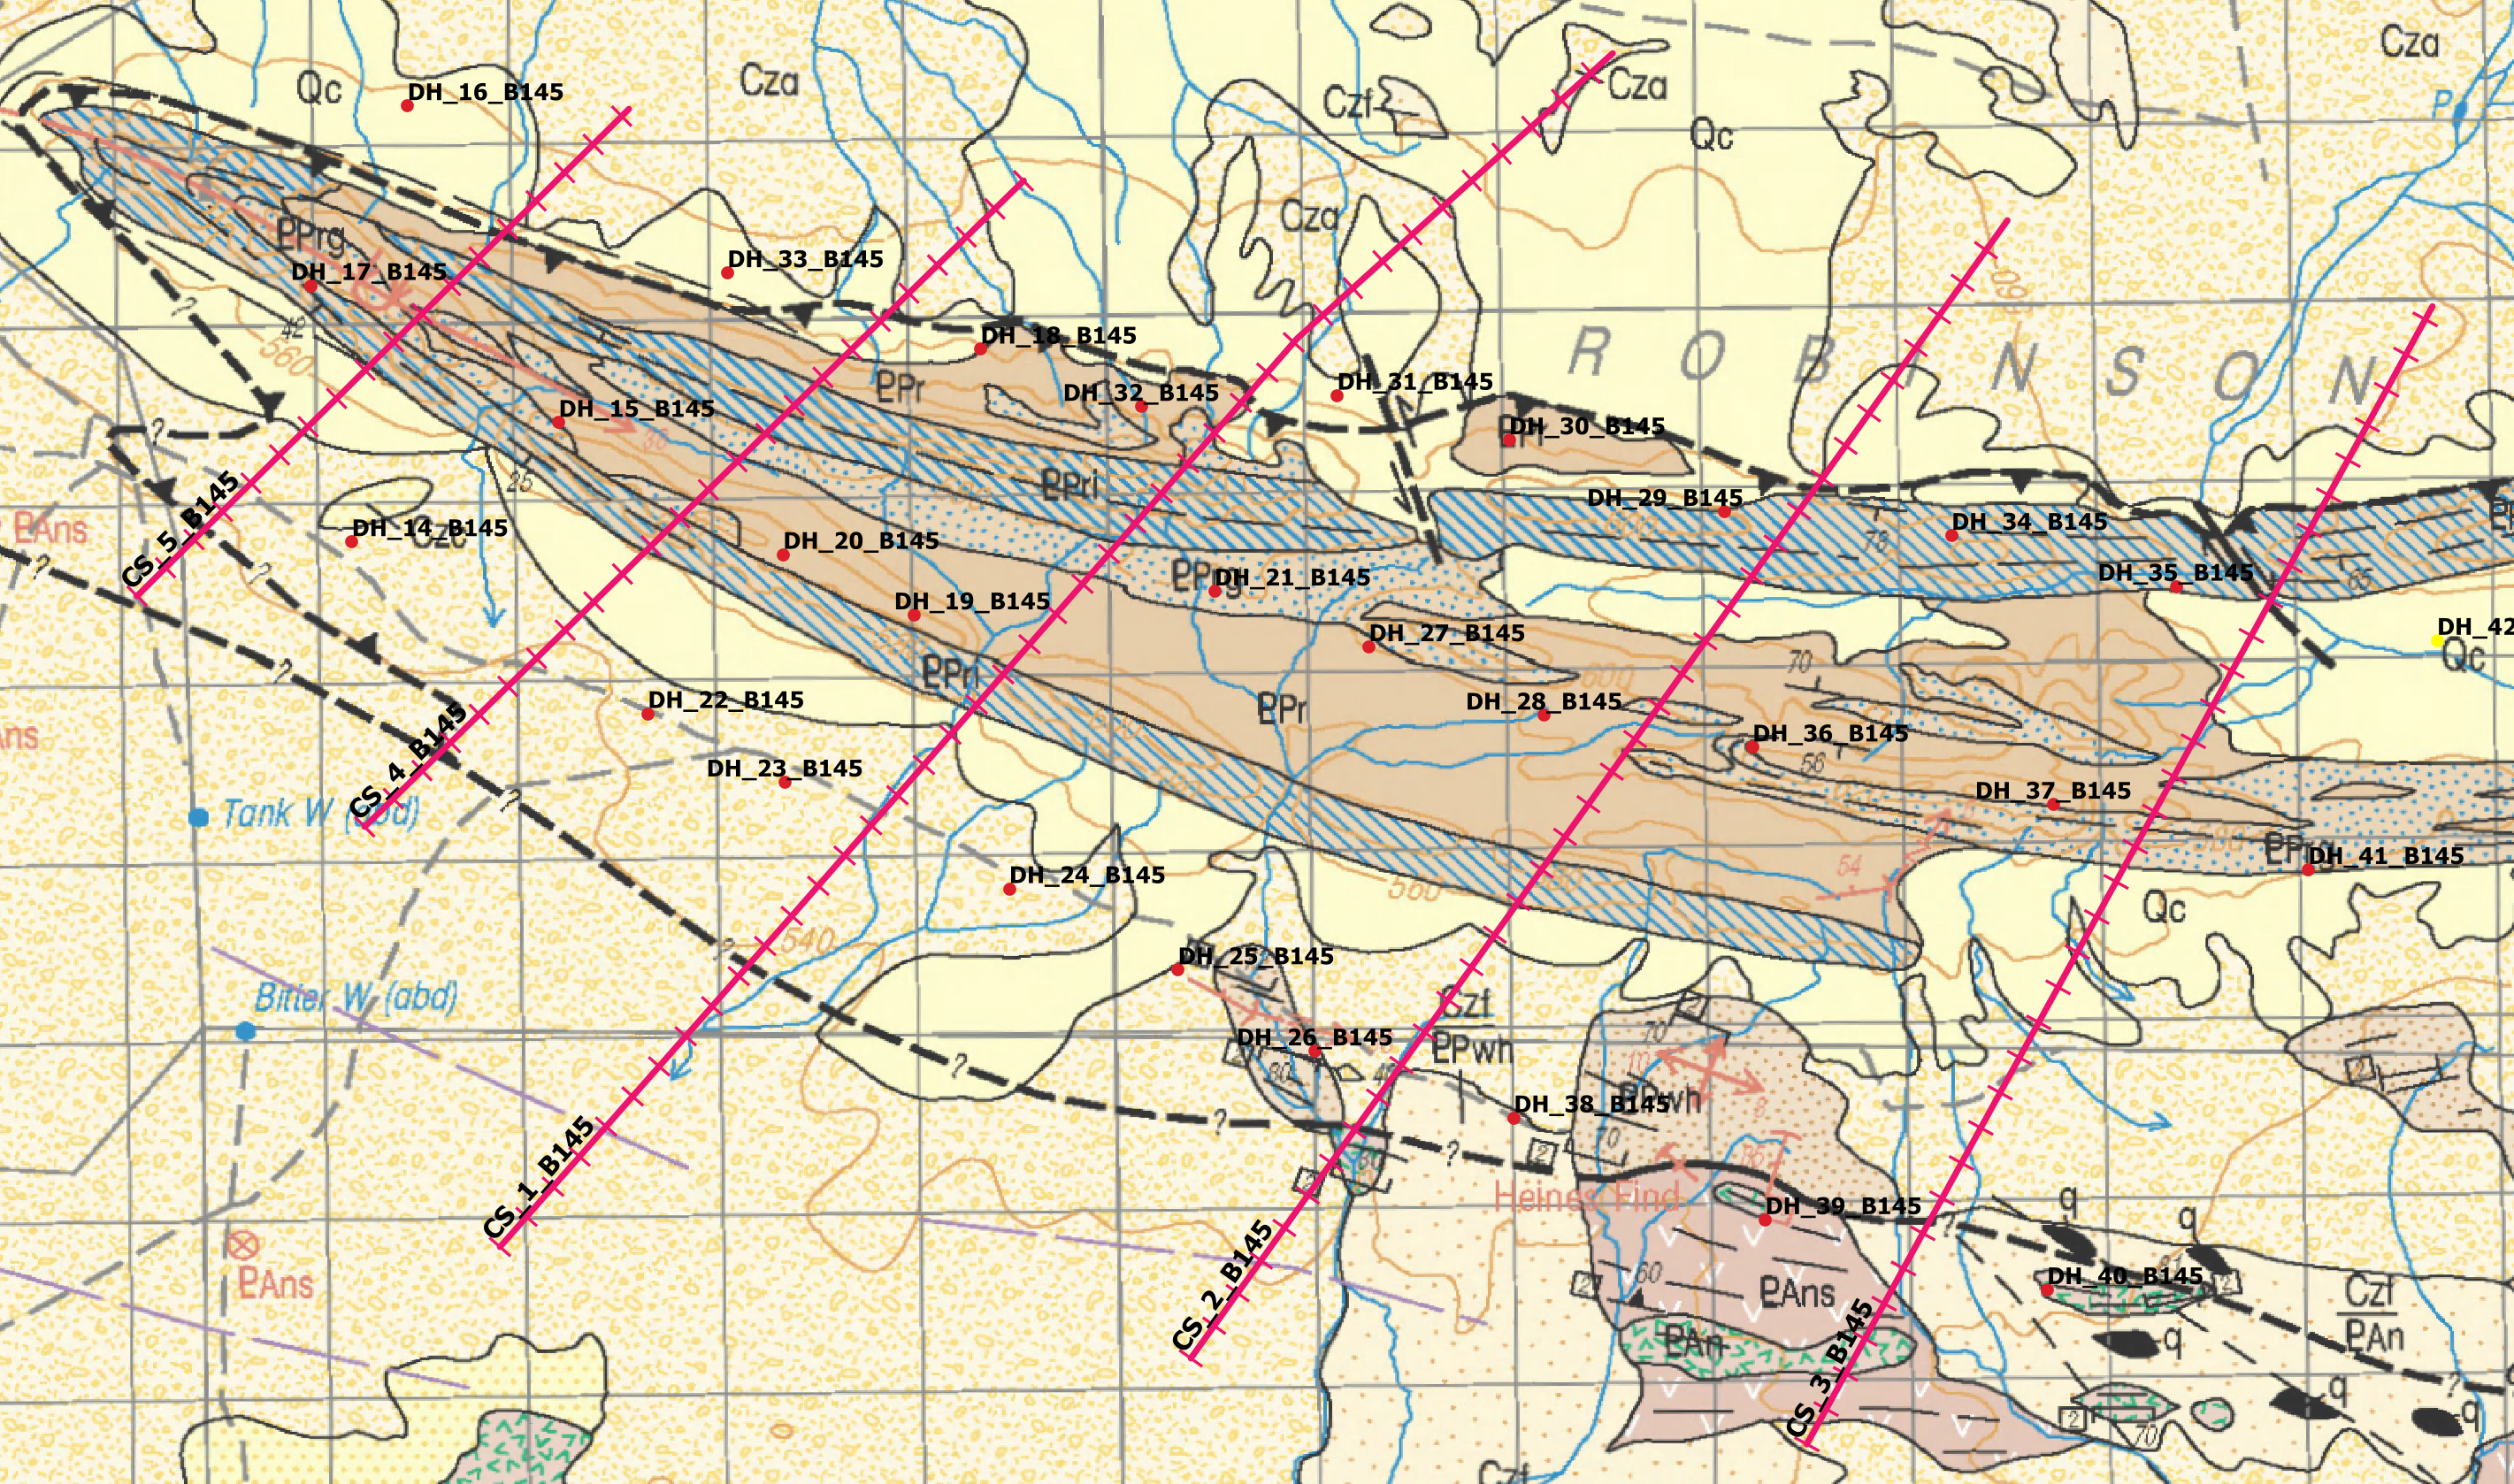
Cross section and geological map view
Map viewer
-
Standard GIS view.
-
3D box view definition from quadrangle vectorisation.
-
Section definition from trace vectorisation.
3D viewer
-
Log/Assay data colour mapping on drillhole path with full LUT controls.
-
Labels, tags, and legends featured with font/size/placement/kernel/orientation controls.
-
Support arbitrary drillhole paths (inclined, curved, intersecting, upwards).
-
Vertical/horizontal exaggeration controls.
-
Standard orthogonal views controls (top, bottom, N, S, E, W).
-
Plane clipping/slicing (top, bottom, N, S, E, W).
-
Selective transparency controls.
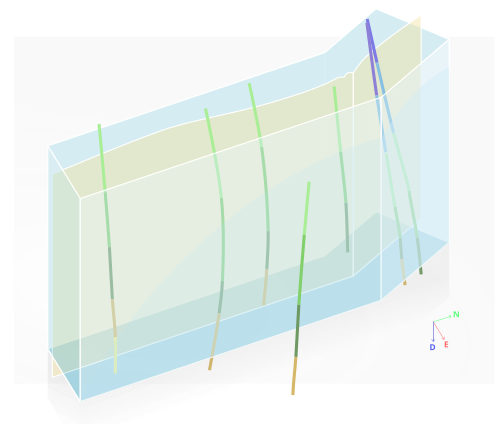
3D visualization and projection box concept
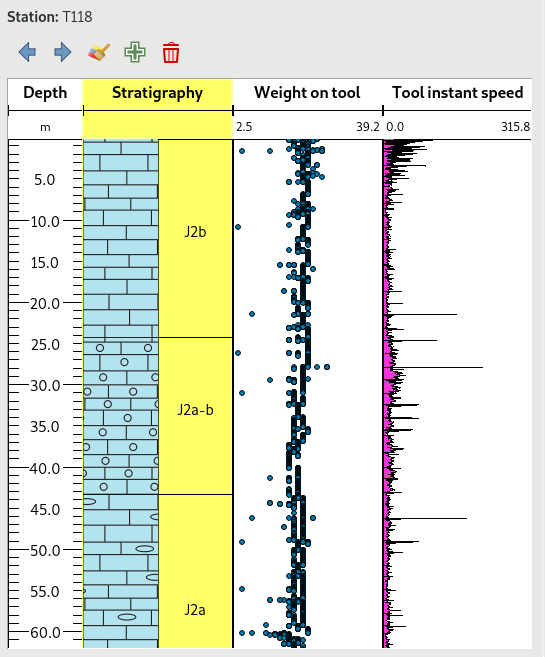
Log view design reference
Log viewer
- Standard vertical drill distance representation
- Geology/alteration/mineralization view
- Assay data graph view
- Controls for labels, tags, and legends
- Downhole structural data projection (apparent dips)
Data management
-
Import/export standard 3 csv tables format (collars, survey, geology, assay).
-
Import/export/connect to existing Acquire, Datashed, Gebank, PostGIS databases.
-
Basic QA/QC toolkit (track issues with topography, bending angles, outliers, etc.)
-
Custom built PostGIS database using the BGS structure as basis.
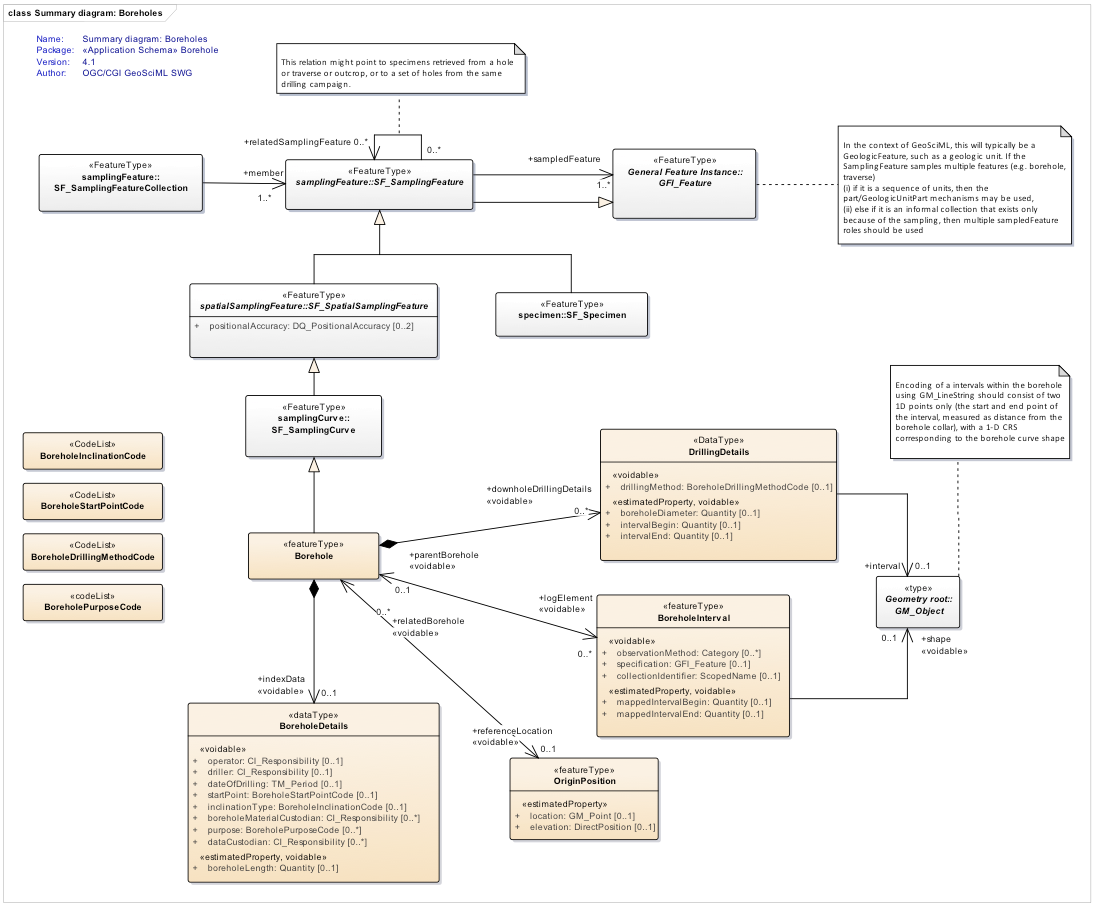
Data model compliant with OGC standards
Multi-viewer interactivity
1D vs 3D vs 3D interactivity
-
Free edit 1D data (geology, numeric fields) and reflect in section and 3D views.
2D vs 3D interactivity
-
Free edit projection distance in 3D with real time projection update.
-
Free edit existing trace in 3D with real time projection update.
Edition
General DH management and editing tool capabilities
-
Create/edit/delete DH path, logs, location.
-
Load in/out additional log data anytime.
-
DH groups for multi-survey cases -> grouped create/edit/delete capability.
-
Dynamic table/1D/2D/3D selection and edition.
-
Split/merge/assign category fields (lithology, geology, alteration).
Section management and edition tool
-
Create/edit/delete sections from arbitrary trace.
-
Create/edit/delete sections lattice from rules.
-
Create/edit/delete inclined sections.
-
Section groups for multi-survey cases -> grouped create/edit/delete capability.
Project management
Approach
Oslandia takes a collaborative approach with its partners and involves them at every step of the development process. Leaders on the project are encouraged to interact as directly as possible with end-users to drive their efforts in the right direction. Conversely, end-users are advised to test intermediate versions and provide both positive and negative feedback via tickets.
Development model
The agile methodology is the preferred way at Oslandia, short term targets are defined during the development phase based on continuous client feedback and challenge recognition. This methodology allows for reduced overhead and flexible outcomes.
Testing methodology
As expected of any software development firm, Oslandia systematically implements unit testing at the very early stages of development. Furthermore, system testing comes into play at the mid stages with the assistance of the client. That is, Oslandia ensure the highest quality by testing the whole application for bugs, performance, and ergonomics issues using real data.
Teamwork
Developers usually group on medium-large size projects based on their technical expertise, interests, and availability. Once a core team is formed around a project, it is maintained until final delivery. Other members may temporarily intervene to relieve pressure or bring specific know-how at the demand of the core team.
Project leadership
A lead developer is selected internally by the core team to drive the technical aspects of the project on a daily basis. A product owner is selected to define the functional targets
Sponsors


Contributors
Technical partners

Why Open Source ?
Freedom
OSS is known to offer great freedoms to its users:
- The freedom to know how your OSS works is paramount to understand what is being delivered.
- The freedom to choose who maintains your OSS is key to ensure that the features you desire are implemented on your terms and in due time.
- The freedom to make OSS your own is essential to build your own skill base and tweak it to your needs with your own proprietary code.
Simplicity & Reliability
With OSS comes the peace of mind of a free license. There is no lengthy meetings with lawyers deciphering the terms of a usage license.
Oslandia OSS is free to use, for any purpose, by anybody, and for ever.
Freedom is also the guarantor of long term reliability as, no matter how much time passes, someone with the rights skills will always be able to pick up the code base where we left it.
Accountability & Safety
OSS is open to scrutiny by design, our clients, users, and competitors are free to inspect every line of code as we go through the development process and on after.
With so many eyes watching, it is the most secure type of software and it is no coincidence that all reliable encryption algorithms are OSS.
Performance & Innovation
Because there is no provider exclusivity for support, maintenance, or even development, the race is always on for professional OSS developers like Oslandia. We are always on the lookout for the most optimized solutions for our clients.
How to contribute ?
Open Source Software (OSS) development at Oslandia encourages corporate as well as individual financial and in-kind contributions from industry experts, academics, software engineer or anybody with a keen interest in bringing OSS to the mines.
Monetary contributions are essential to the completion of the project. All such contributions are tied to a guaranteed feature contract and translate directly and transparently to development hours.
Corporate actors with an interest in OSS are encouraged to contact us for more information about the benefits of supporting Oslandia.
Following an initial private phase, individuals seeking to contribute in-kind to the project will be able to do so via Oslandia-reviewed pull requests to ensure cohesion, stability, and reliability of the code base.
Previous knowledge of Python QGIS plugin and/or C++ Qt development is advised.
All software development projects rely on power users and experts to test and provide feedback. Such contributions are essential to build the most robust and practical solutions.
Software engineering is best done with real test data, mine or exploration scale drillhole datasets are therefore valuable contributions. If required, such datasets will be kept confidential and be destroyed upon completion.
OSS lives through its community: declarations, endorsements, participation in discussions all contribute to success.
“I use QGIS.” is a powerful statement.
Timing

Who is Oslandia ?
Oslandia is a successful tech company founded in 2009 by Vincent Picavet in France.
We specialize in Open Source GIS development & support and we line up the largest team of active contributors to the QGIS project with over 15 full time developers.
Our software engineers also demonstrate the highest expertise in PostGIS, the high performance spatial database technology at the core of QGIS.
Oslandia’s business model focuses on industrial quality Open Source software financed and directed by users.
All Oslandia software is freely accessible to all, forever, for any purpose.

