The project has been swarming lately, so it’s time for us to give you a little summary of everything that’s been happening over the past few months!
What is Giro3D?
Giro3D is a 3D visualization library for web browsers, written in javascript and WebGL. Giro3D is based on THREE.js, leveraging all the power of one of the best 3D engine for the web. Giro3D also provides support for the tiled formats typical of GIS as well as primitives and geographic concepts.
For the support of standard protocols (WMS, WMTS…), it is possible to use OpenLayers sources.
The code repo is here: https://gitlab.com/giro3d/giro3d
Giro3D inherits from iTowns, but with objectives that diverge slightly from the latter:
- community-driven development of the code
- versatility: the library must accommodate various use cases in the industry: immersive view in galleries, underwater view or natural or urban environment. It must also accommodate various standard data formats
- be fast
- the focus is on the ease of use of the API, which must remain compatible with THREE.js. It is already possible to use directly THREE.js objects or controls.
All these elements guarantee an industrial use.
Recent improvements
A more straightforward API
In order to make the library easier to use, the API has been greatly redesigned to be more intuitive and more easily documentable. The Documentation homepage gives an overview.
THREE.js controls integration
The controls are the navigation mechanisms in the 3D scene. Giro3D allows to save a THREE.js control to Giro3D way and to use it immediately.
Labels
It is now possible to use THREE.js’ CSS2DRenderer directly in Giro3D to display HTML labels on top of the 3D scene. See an example here.
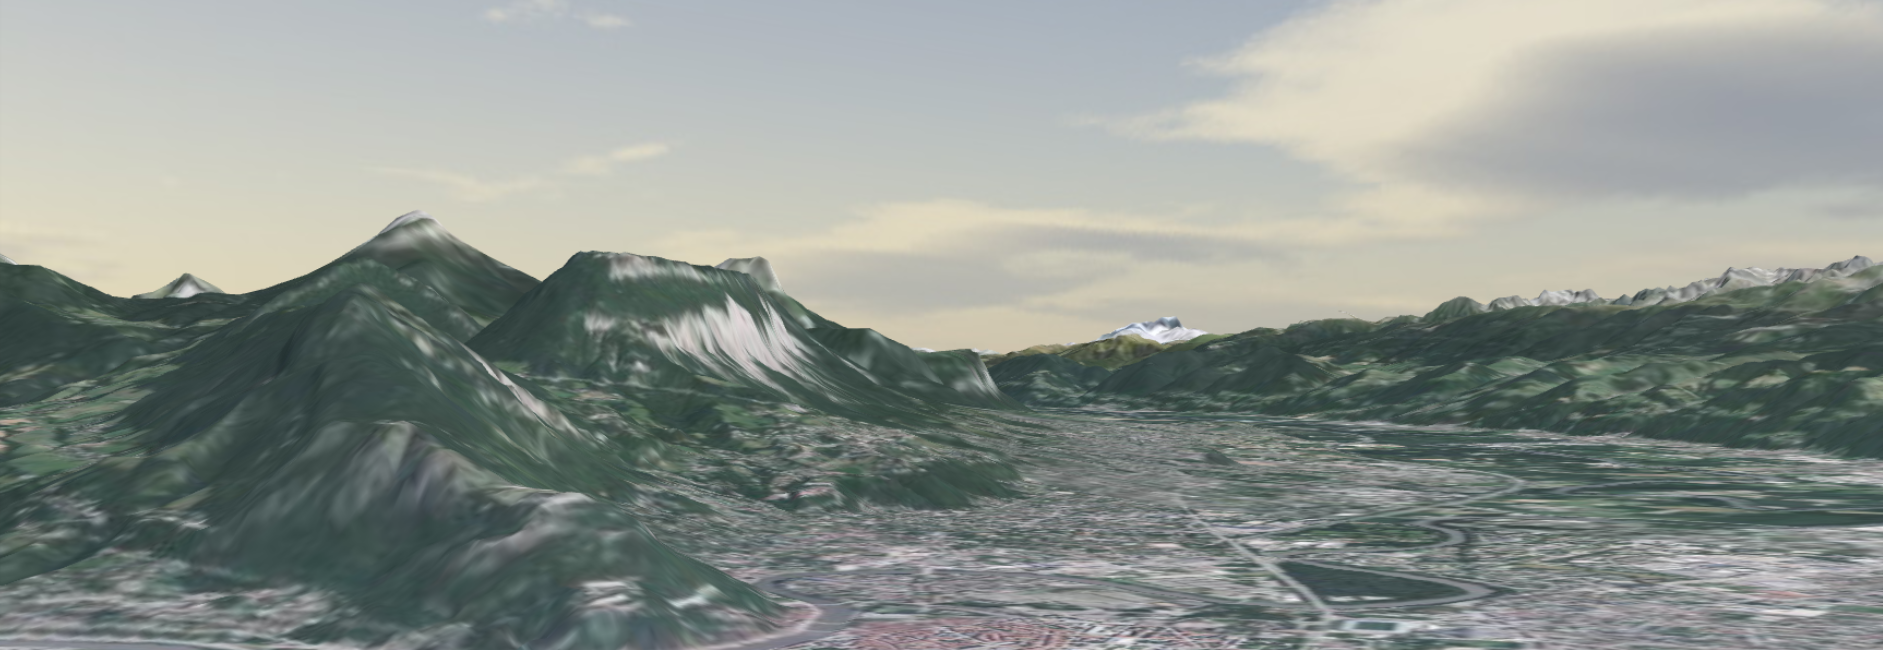
Color Maps support
Giro3D allows to add color maps on the image and DEM layers. See the example.
Several modes are supported: default mode (elevation or pixel intensity), slope and aspect (orientation with respect to north). The creation of color palettes can be done with third party libraries like chroma.js.
Adding a new Entity: “AxisGrid”
This entity is a 3D grid make easier to find one’s way in an elevation dataset. You can test it live here. Fully configurable (graduations, volume, label style), it also supports two display modes (relative and absolute).
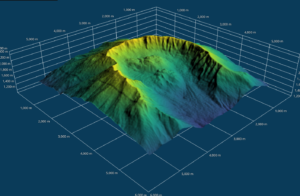
Color maps and Axis Grid on giro3D
Cloud Optimized GeoTIFF (COG) management
Giro3D aims for a full support of Cloud-Optimized Geotiff and more broadly of Geotiff. It is already possible to:
- display COGs as a raster layer in Giro3D, see this example.
- use COGs as terrain, either single-band or RGB (supporting several elevation formats), see the grayscale/elevation example
- Use simple Geotiffs, for example organized in an XYZ tree structure, both as a source of coloring (classic map), or as a elevation (terrain) source.
Of course, like all other raster sources, COGs support color maps.
BIL format support
BIL sources are now supported as elevation or color layer with a “ColorMap”. This is one of the possible formats of the IGN elevation webservices, see this example.
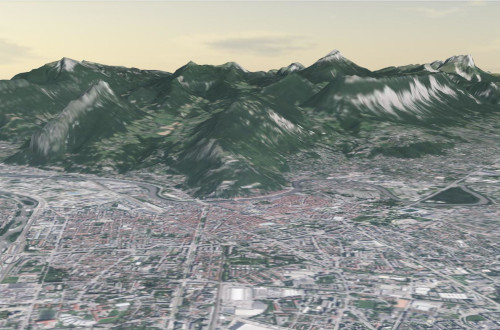
IGN Webservices in action: arial imagery (jpg format) and terrain data in BIL format
Documentation
The website giro3d.org has been revamped.
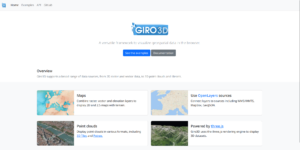
giro3d.org (2023-01-01)
Same thing for the API documentation, still a work in progress.
Api documentation of giro3d.org as of 2023-01-01
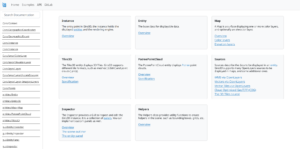
And many interactive examples have been added.
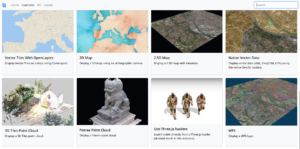
Example page of giro3d.org as of 2023-01-01
We plan to turn some of these examples into full tutorial pages.
The Oslandia Roadmap
A lot of ideas are in the pipeline! Here we describe the most notable features.
IFC
A first example loading an IFC is already available on the website. This example uses a THREE.js loader. Here we leverage the capabilities of this 3D library.
Nevertheless, for large files, it is preferable to go through an upstream processing to convert it to a tiled and optimized format. The ideal format is 3dtiles.
Converting to 3dtiles is not the role of giro3d, but more that of projects like py3dtiles for example.
This being said, the support of i3dm (one of the 4 possible tile formats embedded in a 3dtiles) will be necessary to have a result with good performance, both on the py3dtiles and giro3d side. We will focus our effort towards this support on the giro3d side.
2d/3d features
We are in the process of redesigning the support of classic 2d vector data (WFS, mvt…) to propose a strong integration with giro3d. It is already possible to display them draped on a Map object for example, see the examples “Native Vector data“, “Vector with openlayers” or “Vector tiles with openlayers“, but a full support for displaying 3D meshes out of these data is still to be completed, supporting extrusion and post-processing for example.
Typescript
The codebase of giro3d grows bigger. For maintenance reasons, we are thinking of introducing a stronger typing system for important objects, which would make easier to maintain the codebase, as well as developing applications using giro3D.
Point cloud rendering improvements
These rendering improvements have been implemented for a long time:
- Eye-Dome Lighting (EDL)
- Occlusion and inpainting, allowing to partially reconstruct surfaces
Here is a small demonstration of these features:
On-the-fly rendering improvement in 3D web scene from Oslandia on Vimeo.
They are present in the PointcloudRenderer, but are not used by default in giro3D. An integration work must be done to make them available via the API.
Miscellaneous
Other features that may interest our readers:
- full resizing support (even embedded in a non-full screen element).
- Inspectors are now available in most examples to help development by providing debugging features.
Feel free to check our changelog or our release page for more information!
Conclusion
Many new things for this viewer. Don’t hesitate to test and give us feedback, especially through our issue page.
The project is open-source (MIT license) and follows a community logic, so don’t hesitate to contribute, especially by opening tickets, contributing to the code or the documentation for example. Don’t hesitate to chat with us through our matrix channel: https://matrix.to/#/%23giro3d:matrix.org.