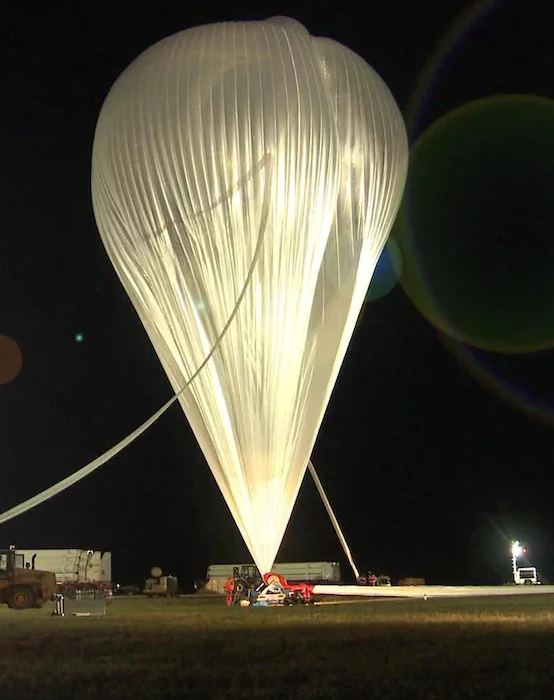
The STRATOS program runs open stratospheric balloons flight since 2013 in partnership with the french spatial agency (CNES). These balloons cover great distances in altitudes between 15 and 45 kilometers, loaded with sensors and scientific equipments (for “scientific experiments, astronomy, stratospheric chemistry, weather forecast and technological prowess”) before falling to the ground after 30 to 40 hours of in space. Their cradle weighs up to 1.1 tons.
The hardware faces conditions similar to space environments and gathers numerous samples during its ascension, allowing in-board telescopes an escape from atmospheric pollution at ground level.
More recently, the canadian space agency started developing a platform of expandable balloons using the same latex balloons as those used for weather forecasting. Since canadian law pertaining to uninhabited balloon flights differs from international and european regulations, flying a 3-4 kg device in Canada requires the use of a certified transponder as well as redundant flight systems.
Tracking these expandable balloons, their position and some sensors is a vital part of the monitoring of flight campaigns. In particular, monitoring the impact area is vital for obvious safety reasons. This tracking requires a great amount of cartographic data and a GIS used both for mission planning and real-time monitoring.
Source: Agence spatiale canadienne
When selecting the tools meeting their needs and federal objectives (open data and open source first), the STRATOS engineers were seduced by the quality, power and values promoted by QGIS.
The Canadian Space Agency team in charge of monitoring flights started migrating their cartographic data to be used in QGIS and asked Oslandia to validate their technical choices and system design, notably the method to ingest data, and ways to attain optimal maintainability and usability.
We were delighted to share about good practices tailored for their needs.
We recommended using a Postgres/PostGIS database to facilitate handling of voluminous data, as well as optimizing interactions with QGIS (e.g : switching between visualization contexts, styling…).
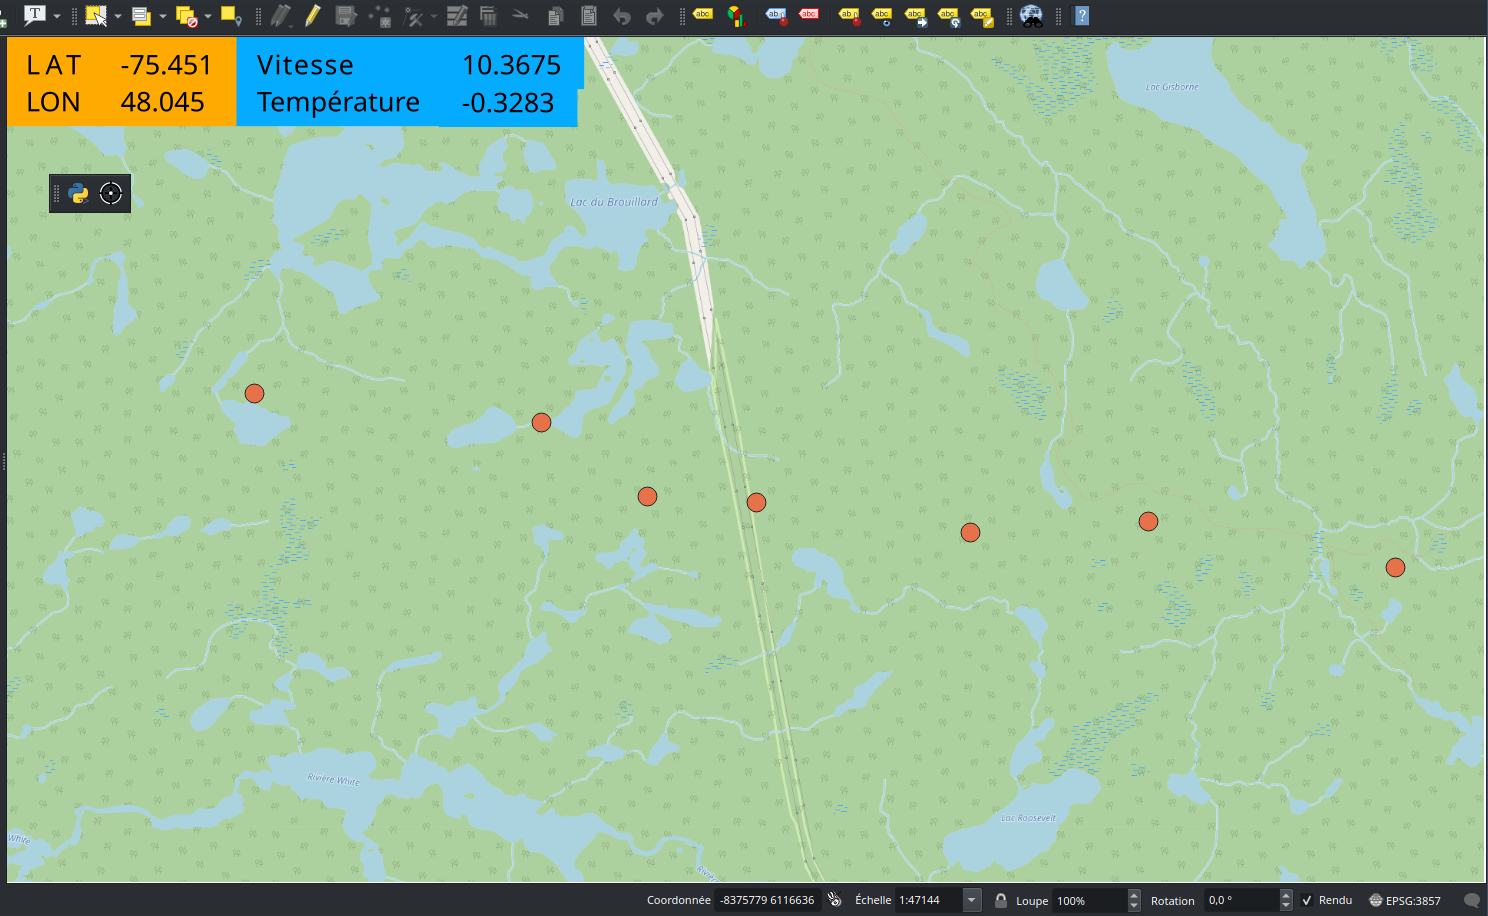
We quickly developed a proof of concept using a labeling method to create a dashboard, similar to this project, or this article, to monitor expandable balloons, their sensors and position.
Following enthusiastic feedback from the STRATOS team, and the will to open and share future work, the Canadian Space Agency is looking to create a QGIS plugin for visualizing simulated trajectories, the true position of aircrafts, and probable landing area. This plugin would then be published for general use.
In order to be able to gather and migrate existing tools to the QGIS plugin, the Canadian Space Agency asked Oslandia for a QGISDEV1 training session.
Oslandia is proud to provide assistance and consultancy services to help the STRATOS team achieve development autonomy and open-sourcing their plugin. We also hope that the astrophysics community and other actors will find it useful, and are looking forward to see it used on a future STRATOS mission !

