In a previous article, we described the clustering of bike sharing stations in two french cities, i.e. Bordeaux and Lyon. We saw that geospatial clustering is interesting to understand city organization. Results were especially impressive for the Lyon data set.
Here we propose to continue the effort about bike sharing system description by attempting to predict the bike availability rates for each station in Lyon.
Collecting the data
As in the previous article we can use almost two months and a half of recordings at every bike sharing stations in Lyon, between 2017/07/08 and 2017/09/26.
By simplifying our data, we can see that we get timestamped bike availability data at each station.
         station                  ts  stands  bikes bonus
5561337     2039 2017-09-06 22:13:17       2     15   Non
7140294     3088 2017-09-22 18:46:50      13      3   Non
1835180     1036 2017-07-28 22:57:23      14      3   Oui
1980966    10061 2017-07-30 16:36:08       7     11   Non
2196562     8009 2017-08-02 08:17:11       2     17   Non
We preprocess a little bit more these data so as to extract timestamp features and the probability to find a bike at each period of the day. Here data is resampled to 10-minute periods, and the amount of available bikes is averaged regarding records gathered during each period.
   station                  ts  bikes  stands  day  hour  minute  probability
0     1001 2017-07-09 00:00:00   15.0     1.0    6     0       0      0.93750
1     1001 2017-07-09 00:10:00   15.0     1.0    6     0       0      0.93750
2     1001 2017-07-09 00:20:00   14.5     1.5    6     0      10      0.90625
3     1001 2017-07-09 00:30:00   14.5     1.5    6     0      20      0.90625
4     1001 2017-07-09 00:40:00   11.5     4.5    6     0      30      0.71875
This is the final data set that we will give to the predictive model. To improve the quality of predictions, other types of data could be integrated to this framework, e.g. weather forecasts (however we let it for a further study).
Predicting shared bike availability
The first practical question to answer here is the prediction horizon. Here we will attempt to predict the bike availability after 30 minutes. It could be a typical problem for a user who wants to plan a local trip: will he find a bike at his preferred station, or should he walk to the next one? Or maybe should he look for an alternative transportation mode, as there will be no bike in the neighborhood nearby?
Let’s use two weeks of data for training (i.e. from 2017/07/11 at 0:00 a.m. to 2016/07/26 at 10:00 a.m.) so as to predict bike availability on the network in the next hour (i.e. 2017/07/26 from 10:30 to 11:30 a.m.). The explicative variables will be the station id, the timestamp information (day id, hours, minutes) and the station-related features (numbers of available bikes and stands).
To do the hard prediction job, we use XGBoost (see doc here), a distributed gradient boosting method that can undertake classification as well as regression processes. Here, we are in the second case, as we want to estimate the value of a quantitative variable (the probability of finding an available bike at a given station, at a given hour).
Like the AdaBoost model, XGBoost is a boosted tree model which involves a sequence of smaller models (decision trees) and where each submodel training error function depends on the previous model results. Boosting algorithms are amongst the most widely used algorithms in data science competitions.
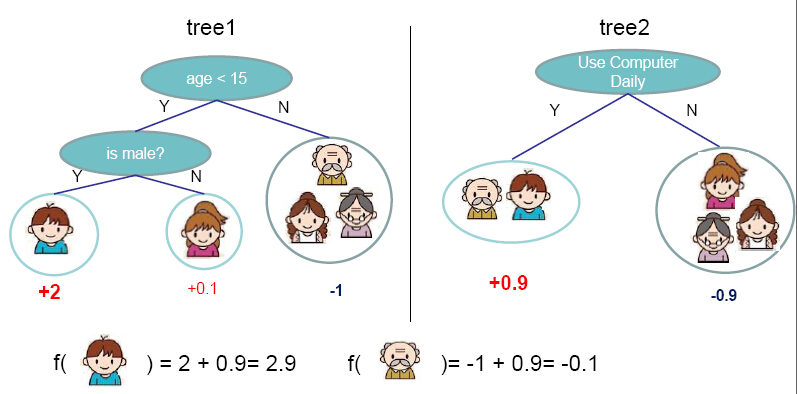
XGBoost model example (from Tianqi Chen): two decision trees are used as submodels to answer the question “does the person like computer games?”
Our model learns quite fast, and after 25 iterations, the training process converges around a satisfying error value (RMSE around 0.095).
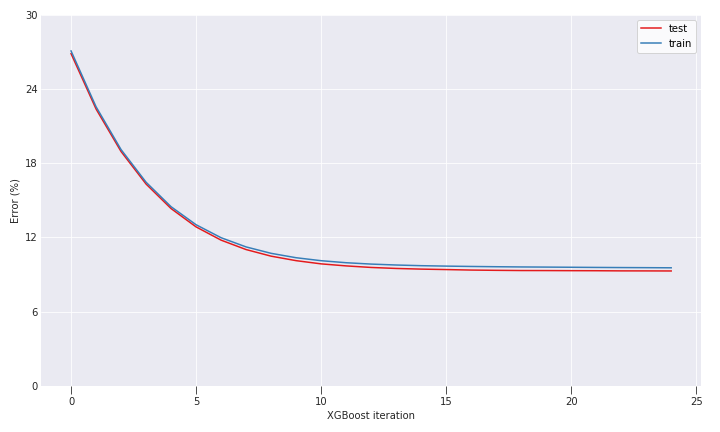
Figure 1: XGBoost training curves (RMSE)
Mapping the predictions
In the last article, we plotted the shared bike stations according to their clusters. Here, we are in a regression problem, we are more focused on the level of bike availability, seen as a percentage.
The following map shows such a quantity, for all stations in Lyon:
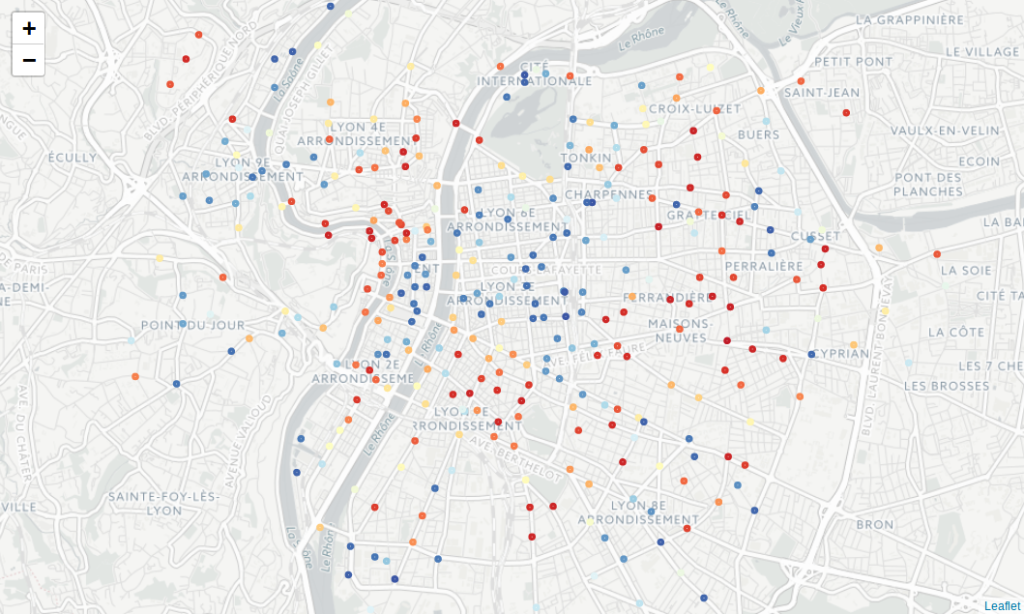
Figure 2: True shared bike availability, per station (red: empty station, blue: full station)
We have to compare it with the prediction provided by the XGBoost model below. With such a color scale, we can say that the prediction looks good:
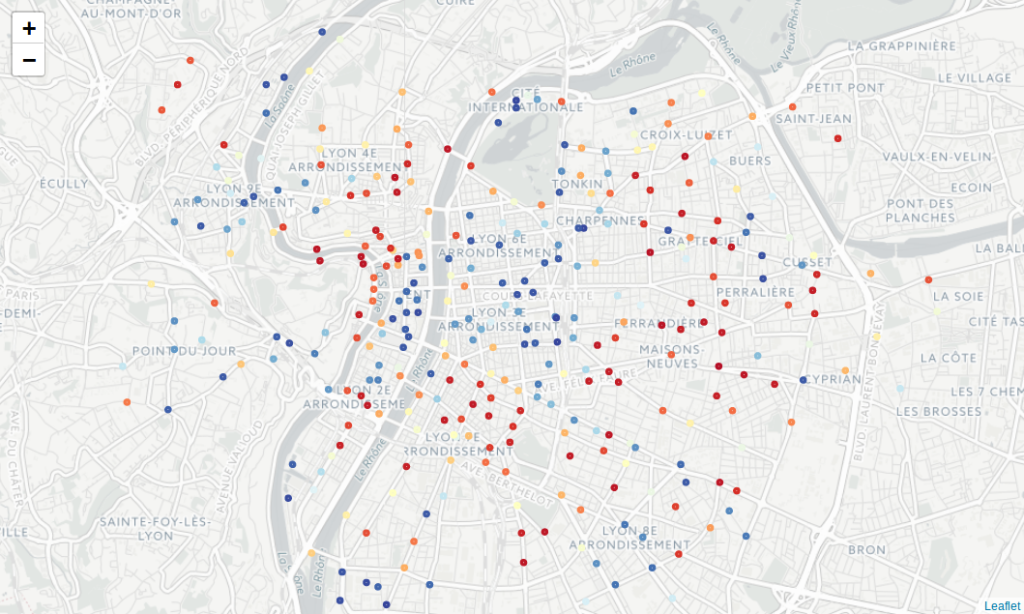
Figure 3: Predictions on shared bike availability, per station (red: empty station, blue: full station)
If we focus on the prediction error, we may highlight bike stations where the model failed to give an accurate prediction:
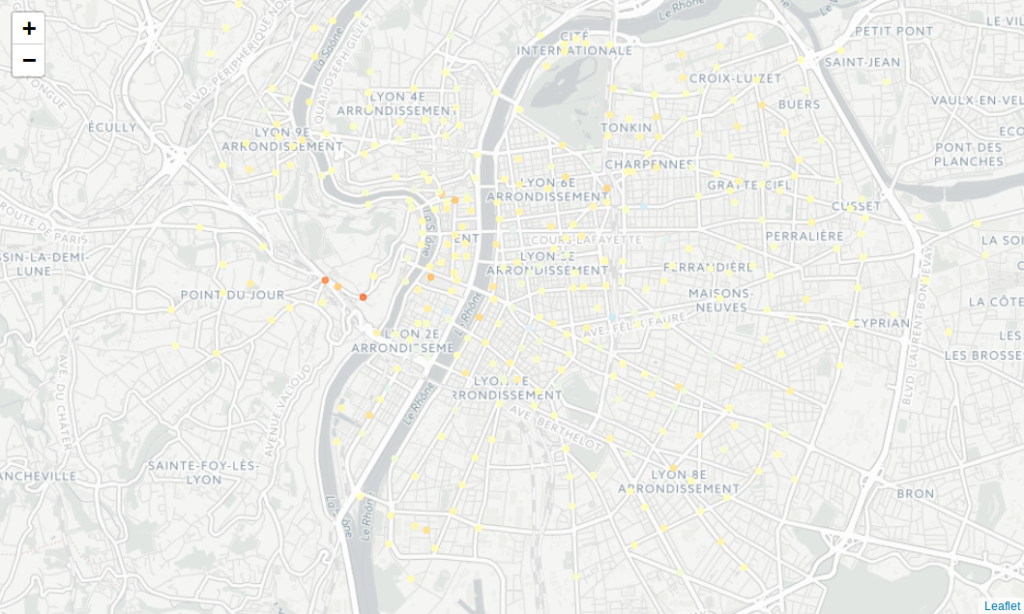
Figure 4: Prediction error (RMSE), per station (red: less bike than ground truth, blue: more bike than ground truth)
The wrong predictions are sparsely located, with the exception of three stations on the west of the city. These points are on the Fourvière hill, a very hard place to ride with bikes! As if the model were really unconfident
regarding people ability to climb up to these stations…
You may find the code and some notebooks related to this topic on Github. We also thank Armand Gilles (@arm_gilles) for his contribution to the project, through his soon-merged fork.
If you want to discuss about that with us, or if you have some needs on similar problems, please contact us ( infos+data@oslandia.com)!

