This article discusses features released with version 0.38 of Giro3D.
Giro3D 0.38 introduced a new drawing system based on the DrawTool class and the Shape entity. This flexible system allows creating shapes either manually or programmatically.
We will explore how to integrate these drawing tools into a Giro3D application.
DrawTool and Shapes
The Shape entity represents an arbitrary shape, composed of points, lines, and/or surfaces, as well as labels. Its style is configurable (color, thickness, transparency, etc.).
The DrawTool allows you to interactively create shapes by structuring them and setting constraints (e.g., the number of points).
Note: It is entirely possible to create and modify shapes without using the DrawTool.
Standard Shapes (points, lines, polygons)
The DrawTool lets you draw standard shapes using its simple API. The create*() methods return a Promise, which is resolved when the shape creation is complete or when the user cancels it with a right-click. In the latter case, the returned object is null.
Some standard shapes.
Advanced Shapes (angular sectors, elevation changes)
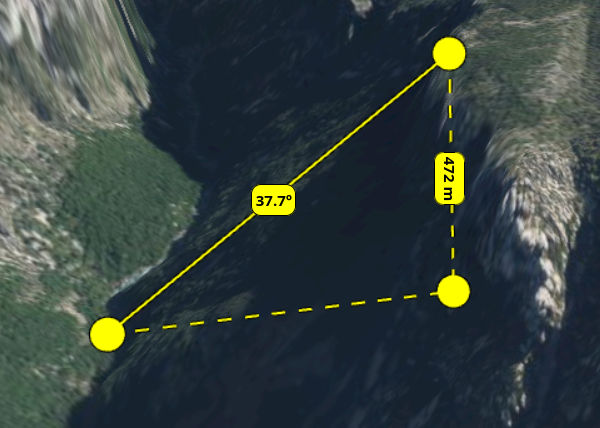
Since the Shape object is highly configurable, it is possible to create more complex shapes such as angular sectors:
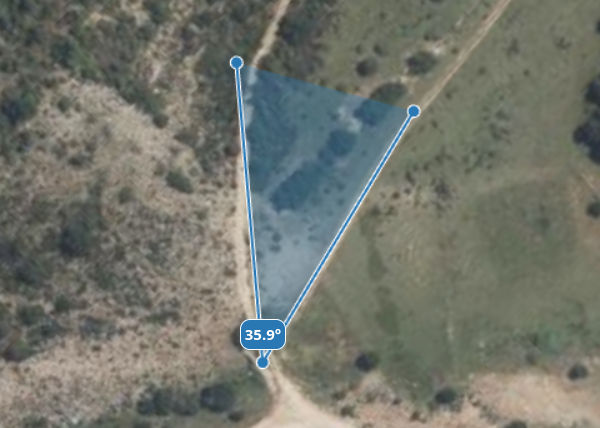
An angular sector.
The createVerticalMeasure() method allows you to create a shape measuring both the elevation change and slope between a start and end point:
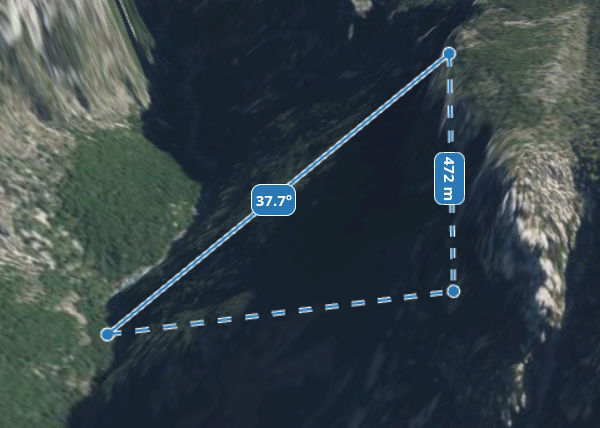
An elevation measure.
Styles
The style of shapes is also configurable, both before and after creation, and dynamically so. You can change the color, thickness of lines and borders, point size, transparency, etc.
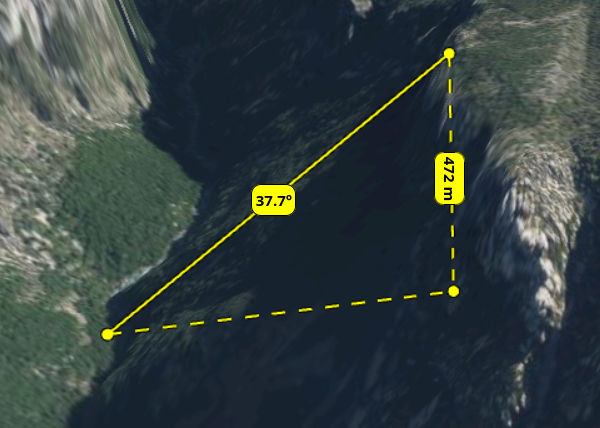
Changing color.
Changing point size.
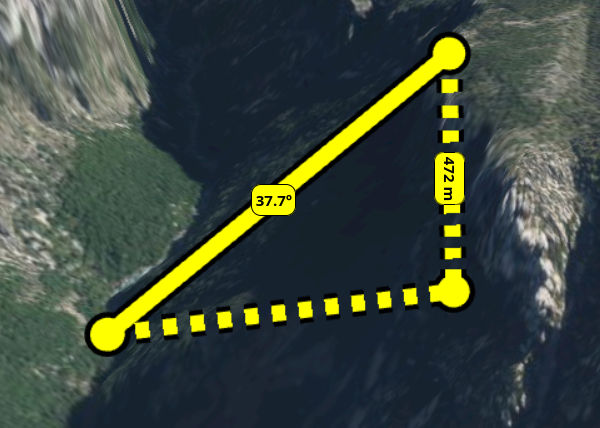
Changing line thickness.
Labels
All components of a shape can receive a label:
- points
- line segments
- the entire line
- the surface
- vertical lines
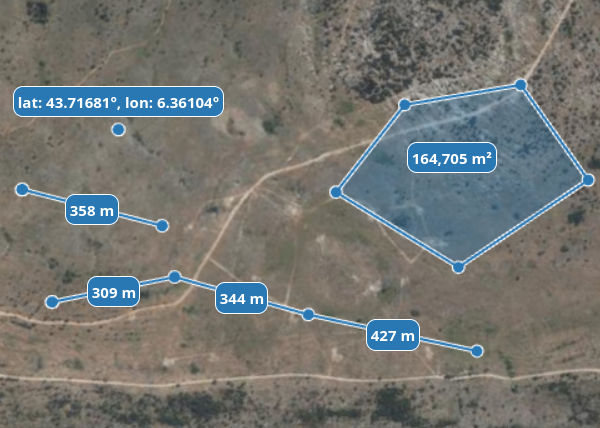
These labels are fully customizable in content. For instance, you can display the geographic coordinates of points, the index of each point in a line or polygon, or any other information.
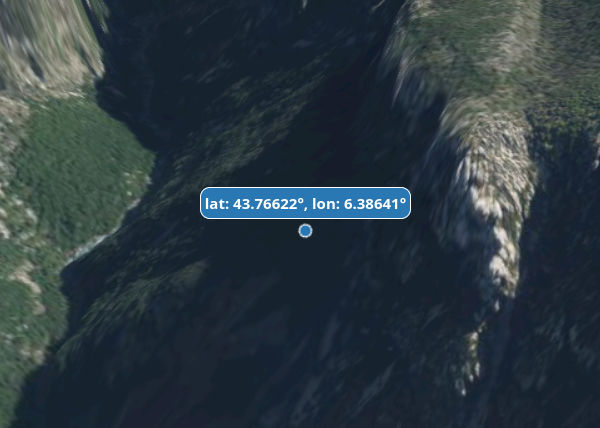
A label displaying the coordinate of a point.
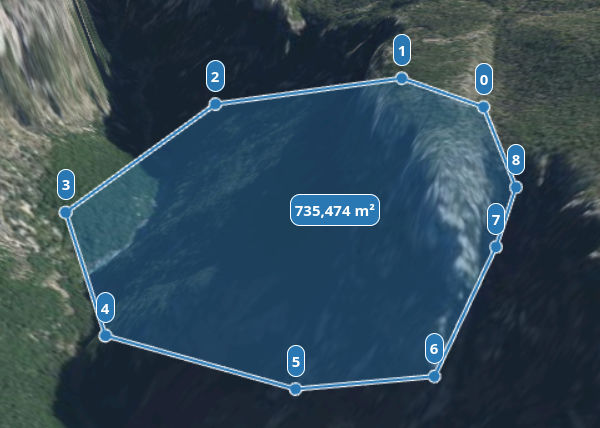
Labels displaying the index of each point in a polygon and the polygon area.
To specify custom content, you just need to pass a formatting function when creating the shape:
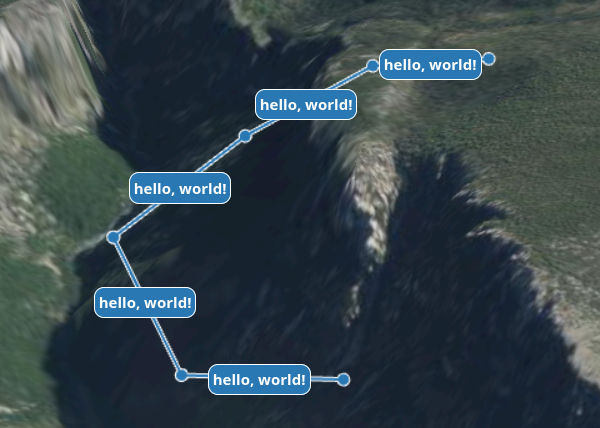
Labels displaying custom content.
To display lengths in feet, we can use the following function:
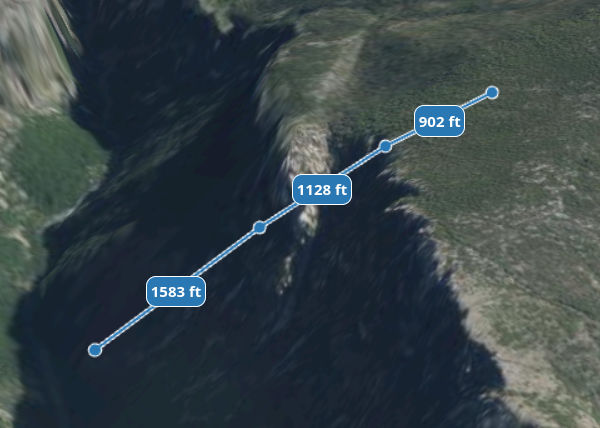
Lengths displayed in feet.
Editing a Shape
It is also possible to modify a shape after its creation using the enterEditMode() method of the DrawTool. In edit mode, you can insert, delete, and move points.
You can also restrict which shapes can be edited by passing a list:
The DrawTool respects the constraints associated with each shape and can prohibit certain invalid operations, such as inserting a point into an angular sector (which can only contain 3 points) or reducing a polygon to fewer than 3 points.
Editing a shape: Moving, inserting, and deleting points.
GeoJSON and OpenLayers Export
If a shape corresponds to a known GeoJSON geometry type (point, line, or polygon), it can be exported in this format.
Note that re-importing a GeoJSON as a shape is not currently supported directly in Giro3D, but it is present in the drawtool example.
It is also possible to export it as an OpenLayers feature:
This feature can then be added to a vector layer displayed on a map. This is demonstrated in the digitization example.
A digitized shape.
Conclusion
The new drawing system allows for numerous applications:
- creating annotations
- measuring distance, surface area, and angles
- drawing elevation profiles
- digitizing features
![(Fr) [Équipe Oslandia] Florent, développeur SIG](https://oslandia.com/wp-content/uploads/2024/08/portrait-florent.png)

