The Giro3D team is pleased to announce the release of Giro3D 1.0.
Giro3D, an open-source geospatial visualization project
Giro3D is a geospatial data visualization library for the Web. Free and open source, it is compatible with many types of geospatial data sources (rasters, vectors, point clouds, etc.). Giro3D’s mission is to enable you to visualize all your georeferenced GIS data—whether 2D or 3D—efficiently on the web.
Free and community-driven
Giro3D aims to be free and community-driven. We welcome all contributions, whether to the source code, documentation, or tests: everyone is welcome!
Giro3D has started the incubation process with OSGeo; you can find the project page on the OSGeo.org website.
Extensible and easy to integrate
Giro3D is designed for integration into applications and has been successfully integrated into React and Vue.js environments. Designed as a toolbox for building geospatial web applications, it is also easy to create your own plugins and data connectors for Giro3D.
Giro3D has also been successfully integrated into QGIS Web Client (QWC), providing this application with 3D visualization capabilities.
High performance
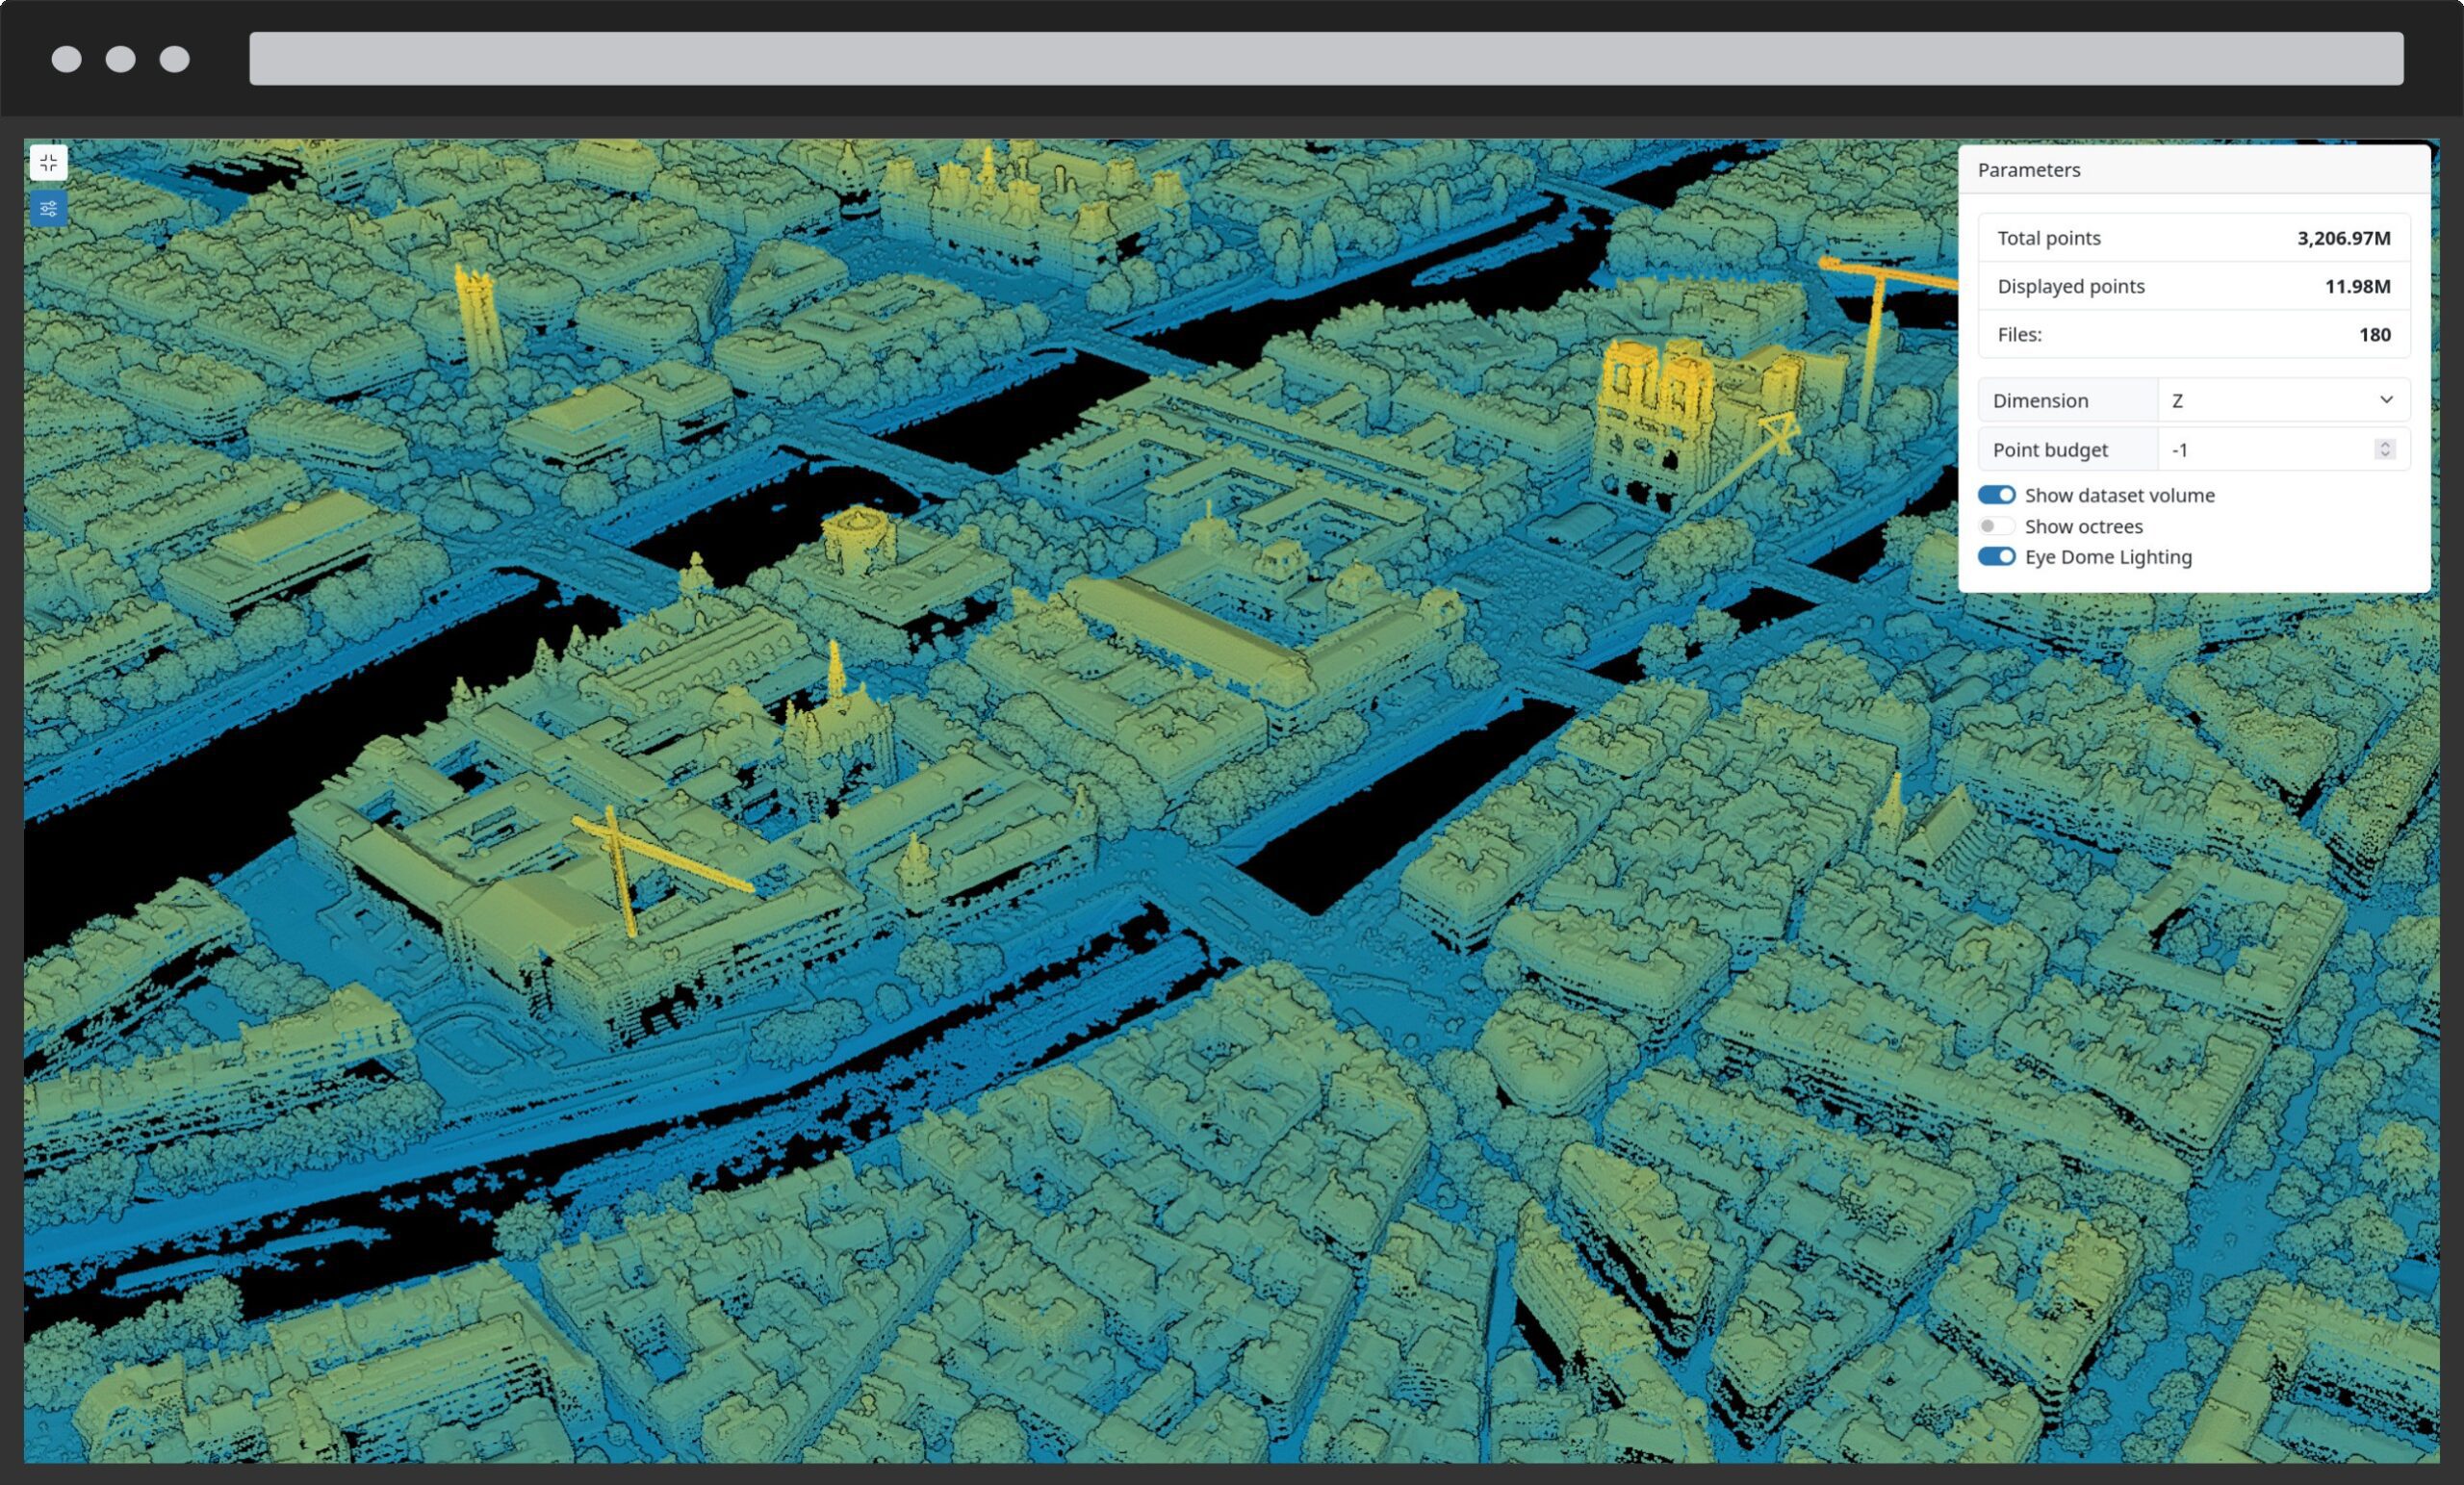
Giro3D leverages web technologies such as web workers and GPU-side processing to enable the display of massive datasets like HD LIDAR or 3D Tiles. Indexing techniques and the use of optimized formats allow the management of very large data volumes, such as terabytes of point clouds.
👉 Feature summary
Geospatial visualization
- Projected or globe mode
- Supports many 2D data types (GeoTIFF, WMS, WMTS, Vector tiles…)
- Supports many 3D data types (point clouds, 3D Tiles, meshes…)
- Lighting and natural illumination (sun, atmosphere, etc.)
- Hillshading
- Advanced visualization (inpainting, EDL, etc.)
- Contour lines
- Clipping planes
- Billboards
- Color ramps for terrain and point clouds
- Masks
- Raster blending modes
- Raster color projection onto point clouds
- 3D grids
- Full access to the Three.js rendering engine and its ecosystem
Geospatial processing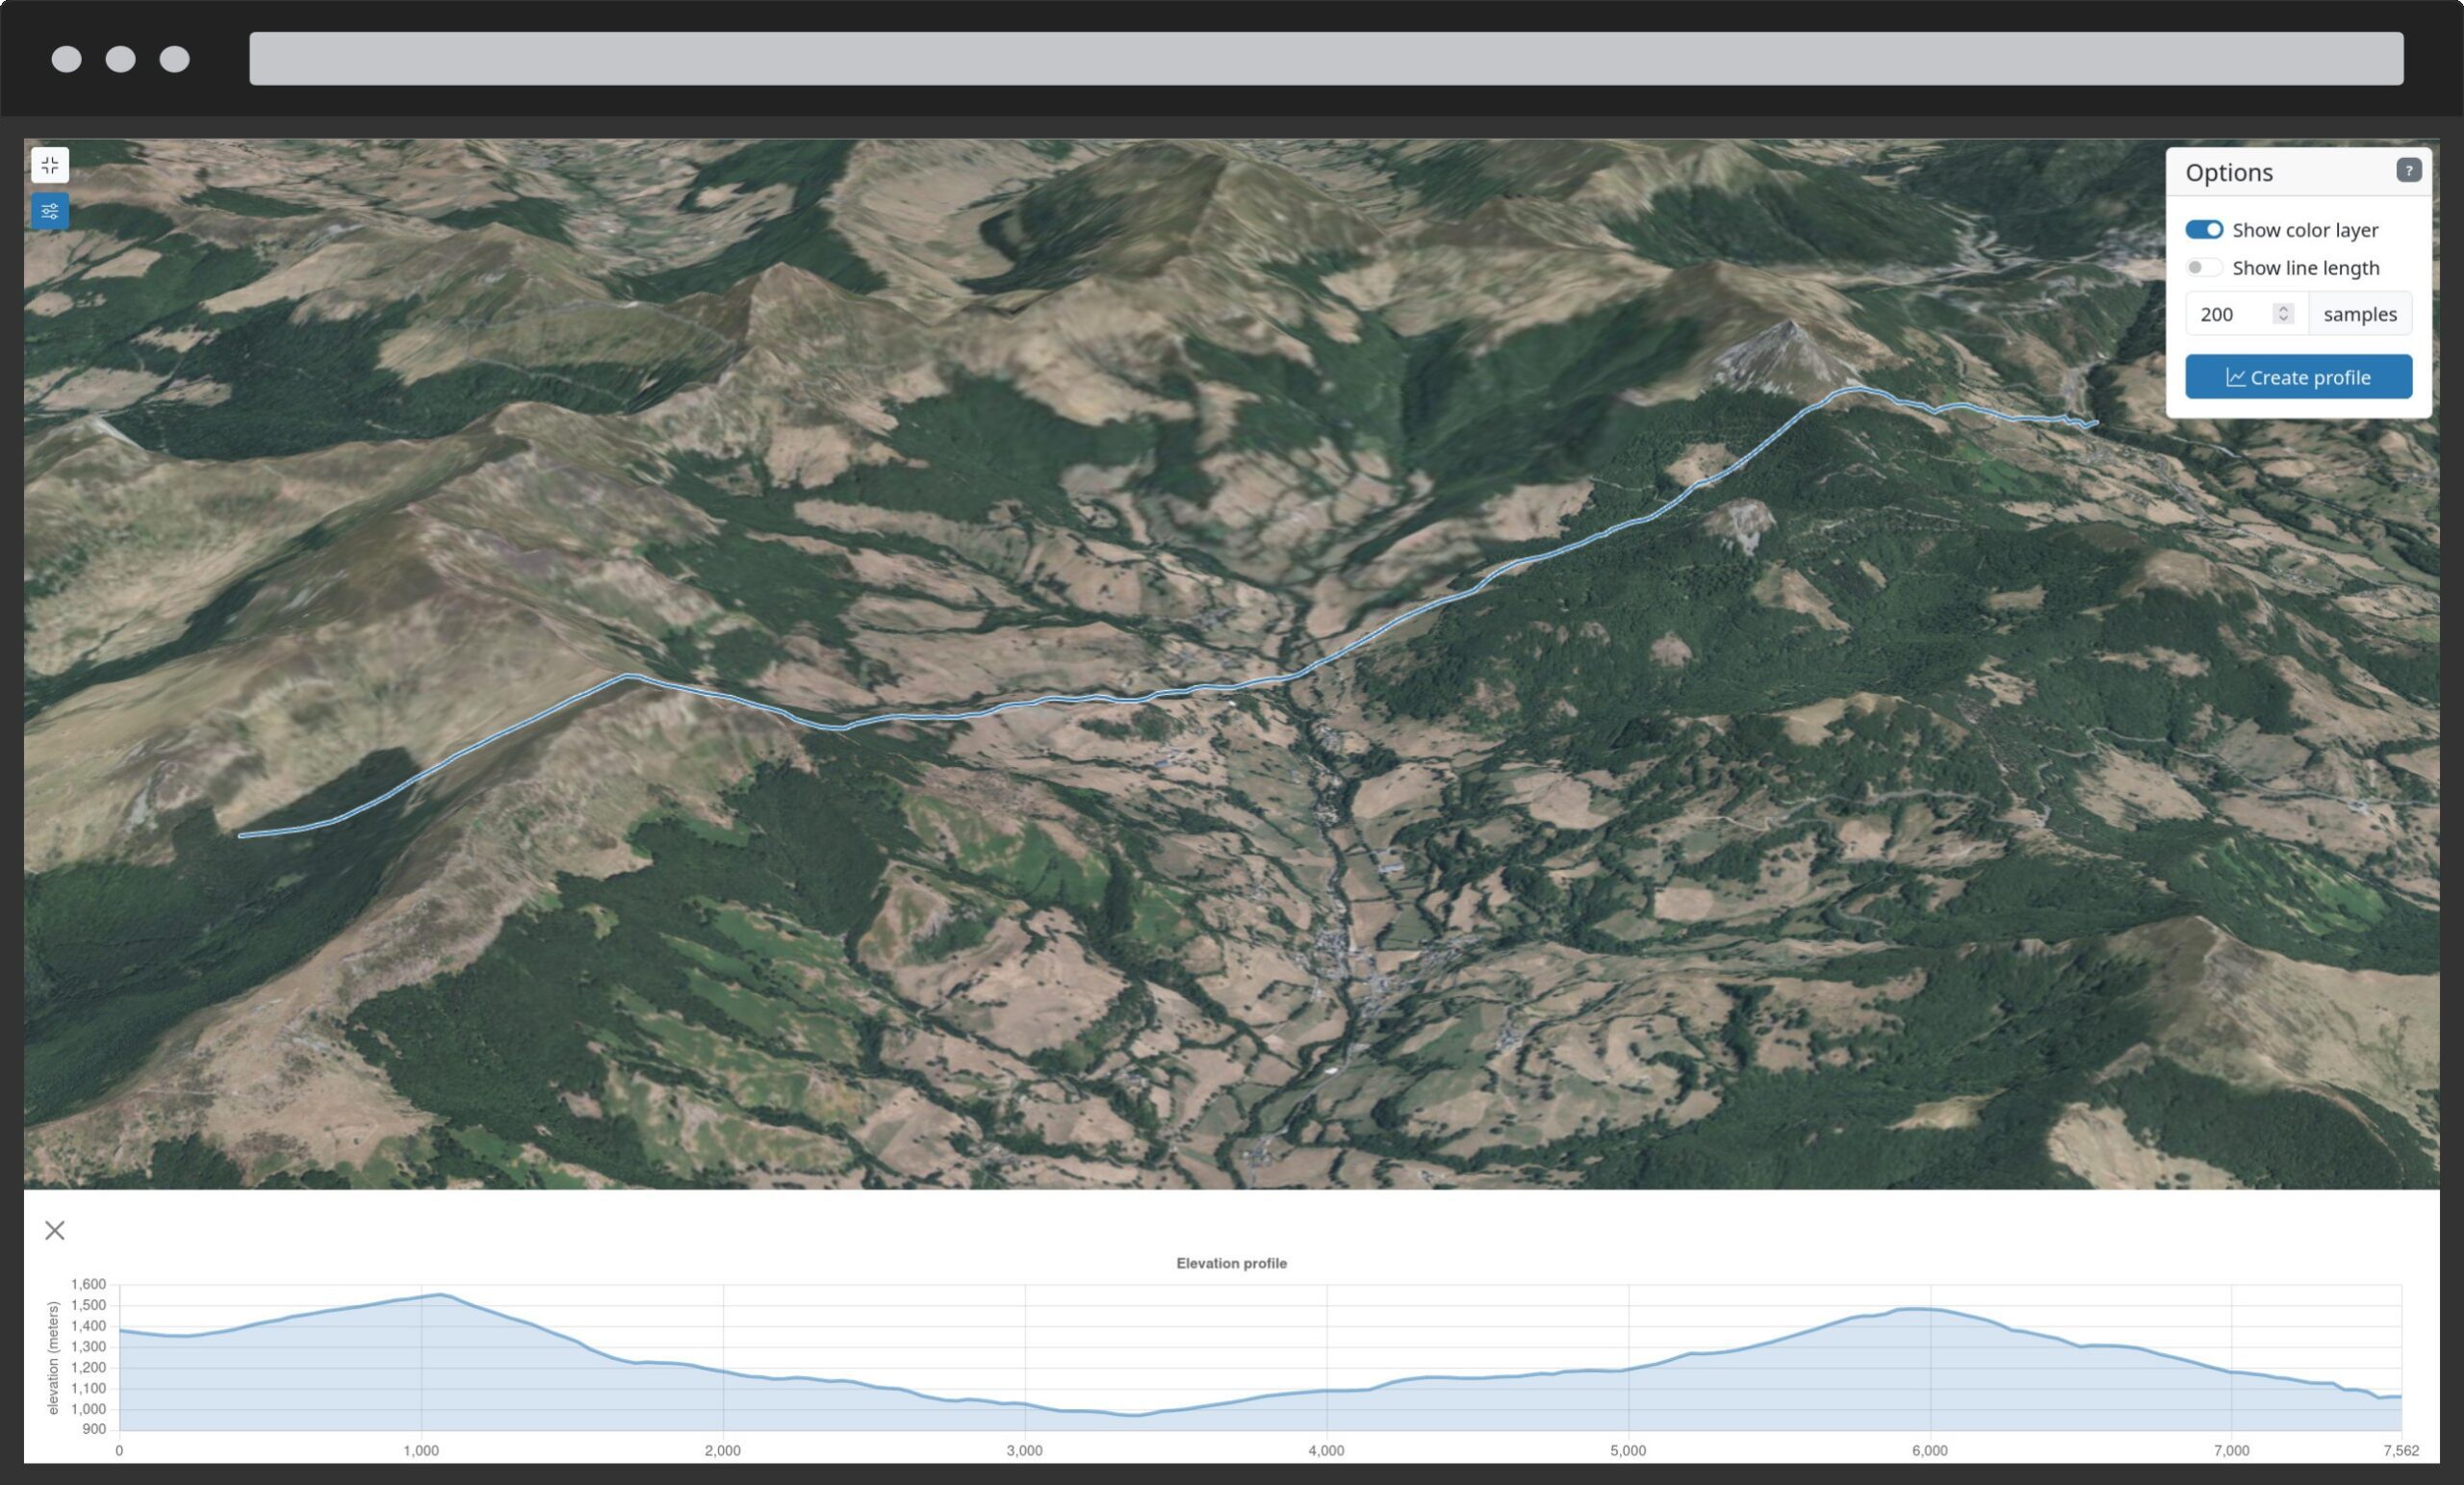
- Support for multiple CRSs
- Raster reprojection
- 3D building extrusion
- OpenLayers styles for vector data
- Optimizations for very large data volumes (e.g. billions of points)
- No-data value handling
- Classification filters
Tools and widgets
- Measurement (distance, area, angles, heights, etc.)
- Drawing (point, line, polygon, etc.), drawing on DEM
- Scene inspector for developers
- Elevation profile
- Minimap
- Data query tool
Giro3D is accompanied by Piero, a fully configurable, turnkey application.
✨ What’s new in version 1.0
Improved coordinate system handling
Proper coordinate system handling is vital to ensure the accuracy and fidelity of displayed data.
Giro3D now correctly handles vertical units in coordinate systems. For example, the Autzen Stadium point cloud uses two different units for its horizontal (feet) and vertical (US feet) axes!
To register a coordinate system, you must now use CoordinateSystem.register():
Oriented images
The new OrientedImageCollection entity enables the display of oriented images in the 3D scene, such as drone photographs.
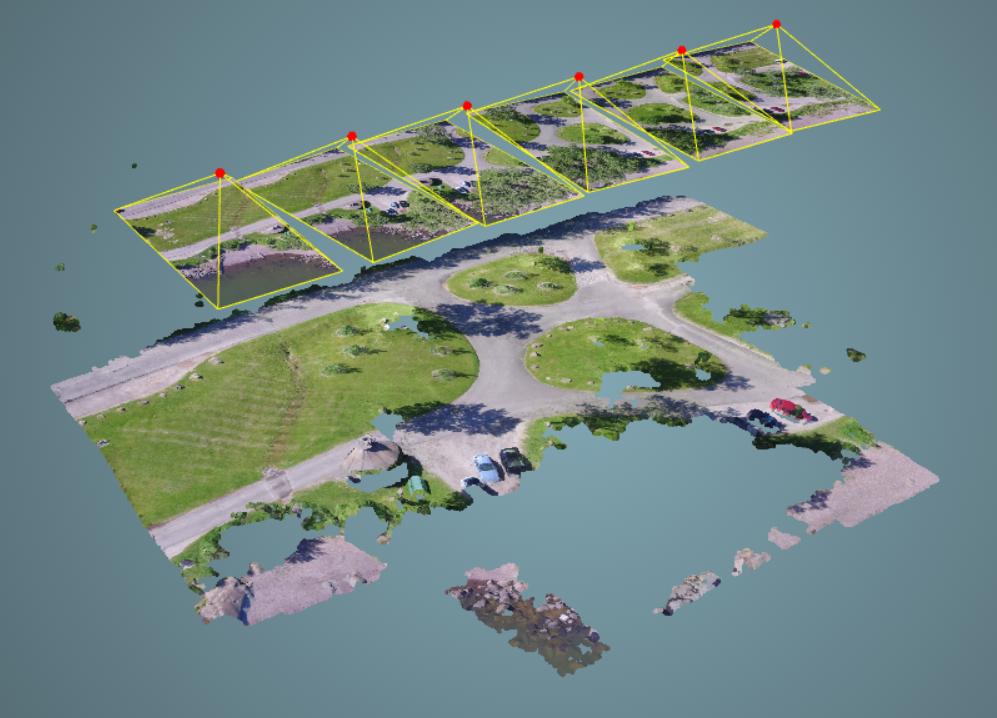
Data from a LIDAR drone survey: point cloud and georeferenced photos. ©2017, Piero Toffanin
Video layers
It is now possible to use a video as a layer for a Map, for example to represent a meteorological timelapse.
A video layer. ©NOAA
Multi-attribute coloring for point clouds
The PointCloud entity now supports multi-attribute coloring. For example:
- intensity + classification
- color + elevation
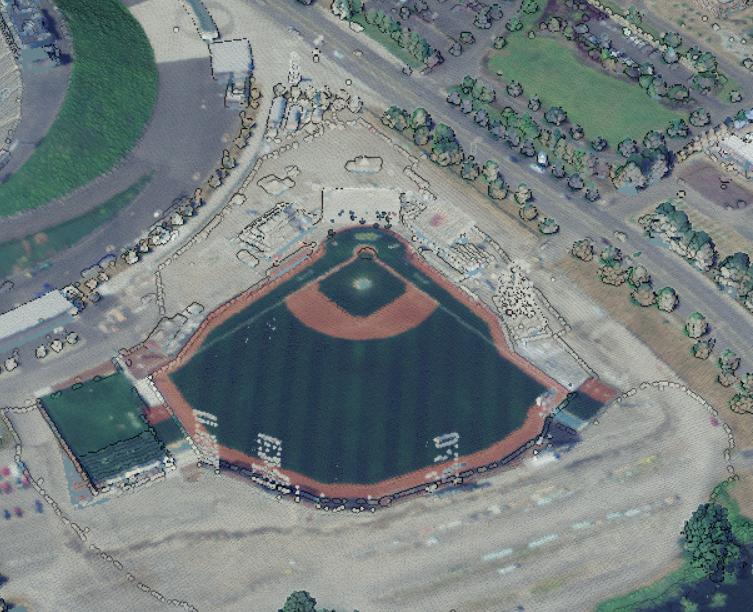
Color only. ©United States Geological Survey
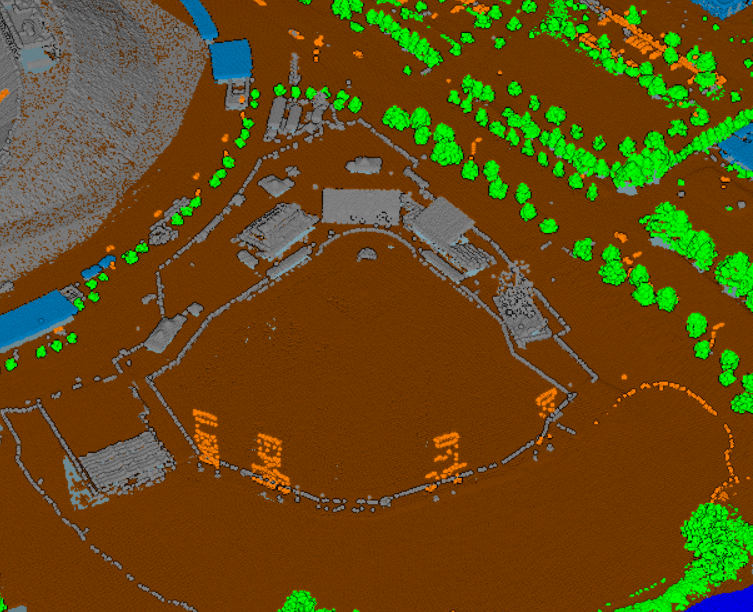
Classification only. ©United States Geological Survey
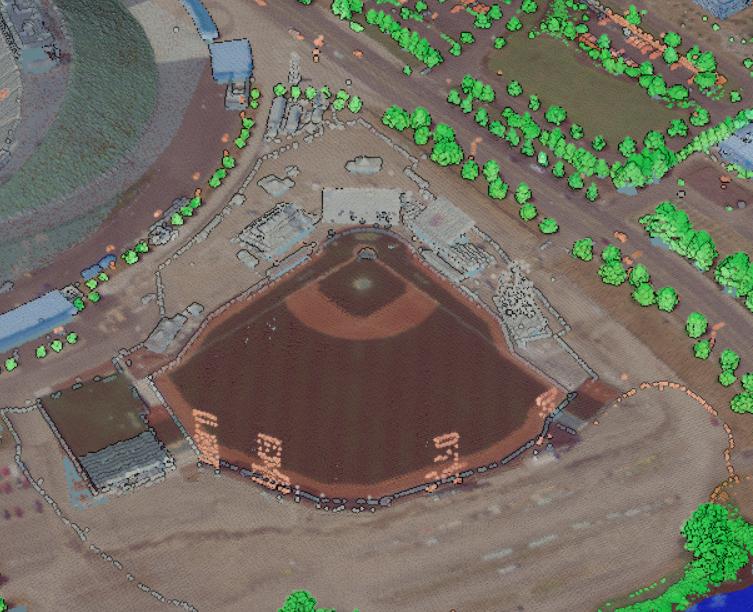
Mixed classification and color. ©United States Geological Survey
Going further
Piero
Based on Giro3D, Piero is a web application that allows you to visualize, annotate, and analyze 2D and 3D geospatial data:
- Terrain
- Imagery
- BIM
- 3D Tiles
- Point clouds…
Fully configurable and extensible through a plugin system, Piero aims to become the reference application in the field of open-source geospatial 3D.
👉 Interactive demo: https://piero.giro3d.org
Acknowledgements
Thanks to Jérémie Piellard (PhoenixLidar) and Karl Tayou for their contributions to this release!
Giro3D in 2026
In 2026, the Giro3D team will continue its improvement efforts. The goals are multiple:
- Implement new data formats (for example 3D Gaussian Splatting, meteorological data)
- Improve integration with the three.js engine
- Fully leverage the possibilities offered by 3D Tiles Next
- Enhance Giro3D’s capabilities in the field of digital twins
👉 And you—what would you like to see in the next versions? Tell us ! infos+3d@oslandia.com
![(Fr) [Équipe Oslandia] Jérémy Garniaux, Doctorant CIFRE en archéologie numérique et développeur SIG à Oslandia](https://oslandia.com/wp-content/uploads/2025/11/portrait-jérémy.png)

