Oslandia team is involved in a constant effort in geospatial data gathering and analysis. By taking advantage of the recent trend in public open data releasing, and after reading an inspiring work done for Dublin data, we decided to evaluate the situation in our own living places. Here comes the open data portals for both cities: Lyon and Bordeaux. The Python code and the notebooks for our open data bike analysis are available on Github.
What is the data looking like?
Both data set have been gathered with a cron plugged onto open data portals between the 8th of July and the 26th of September, i.e. more than 11 weeks of data.
It is important to consider there is no real standardization related to bike sharing open data sets: each city provides its own data set with its own features.
Around Lyon the data set is as follows:
                                   6338022
number                                2023
last_update            2017-09-14 16:48:20
bike_stands                             20
available_bike_stands                   17
available_bikes                          3
availabilitycode                         1
availability                          Vert
bonus                                  Non
status                                OPEN
Whereas for Bordeaux, a record is like:
                             2127658
gid                              157
ident                            161
type                            VLS+
name               Le Taillan Mairie
state                      CONNECTEE
available_stand                    6
available_bike                     7
ts               2017-08-24 22:09:03
However to investigate on bike availability patterns and provide clusters, we only need station ids, timestamps and number of available bikes!
Are there identifiable types of bike sharing stations?
In order to identify groups of similar bike sharing stations in each of these cities, we have run a simple clustering approach on availability data. To keep the data set as simple as possible and work on comparable situations, we have aggregated the measurement to one-hour periods, and dropped the data gathered during week-end days. We consequently have dataframes of N rows and 24 columns (a column being the bike percentage of availability at every station, for a given hour of the day).
We have worked with four clusters, considering elbow method as well as cluster significance.
As shown in the figures below, the global pattern seems comparable between both cities:
- a first cluster (red) groups stations where bikes have high availability rates during the night. They probably refer to residential neighborhoods;
- a second cluster (green in Bordeaux, blue in Lyon) gathers stations near diurnal activities (job places, universities and so on…);
- a third cluster (blue in Bordeaux, green in Lyon) refers to stations where there are almost always a high proportion of available bikes. They are either in less visited places or other transportation modes do the job;
- a fourth and last group (purple) clusters stations where there are a lot of bikes during evenings, and fairly less during the remaining of the day, showing lively night-time neighborhoods.
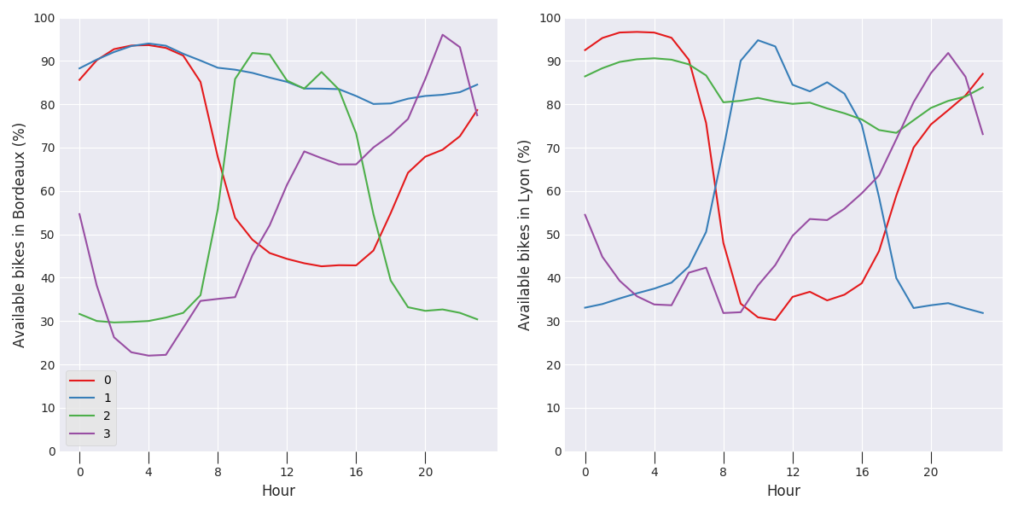 Figure 1: Bike availability patterns in (a) Bordeaux (b) Lyon
Understanding a city from its bike sharing stations
That can be considered quite good for a beginning, however what about the geographical part of the data? Folium (see doc here), a Python library based on Leaflet.js, will allow us to draw interactive maps with our newly designed clusters.
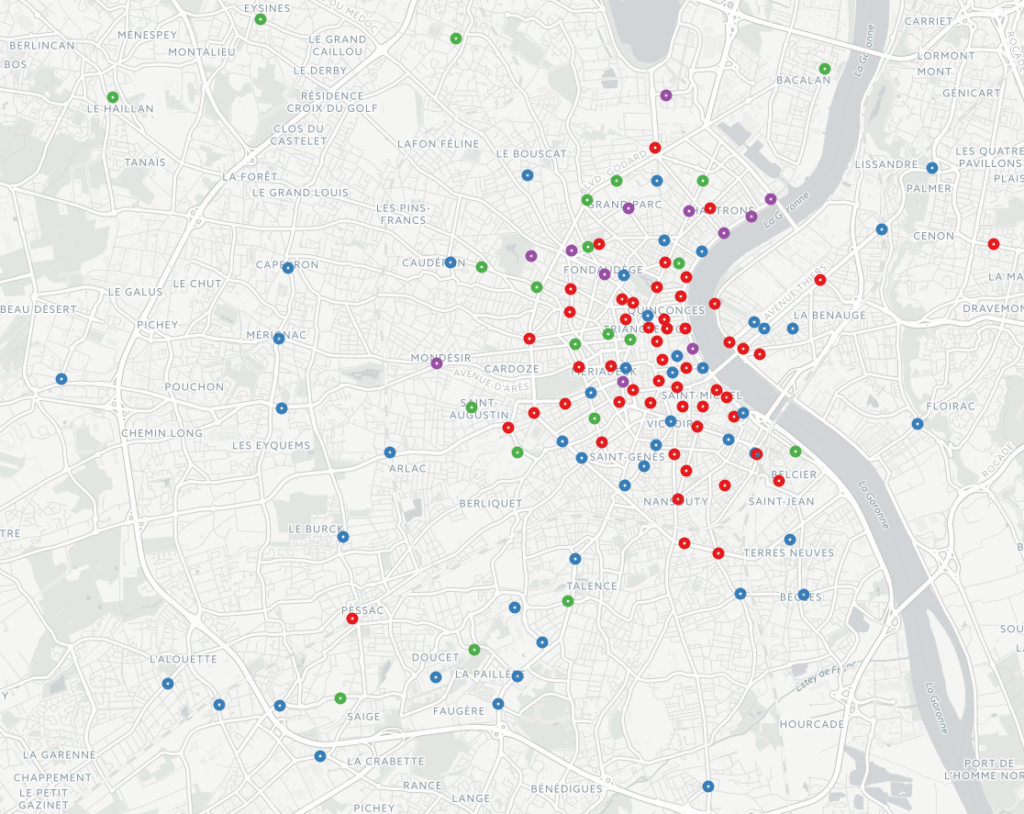 Figure 2: Clustered bike sharing in Bordeaux
The situation of both example cities is quite diverging here, as illustrated by the previous maps. On the first hand, we can see that the Bordeaux spatial repartition is not so clear following the clustering process. Either the cluster process gives insignificant results, or the shared bike usage does not fit the neighborhood division.
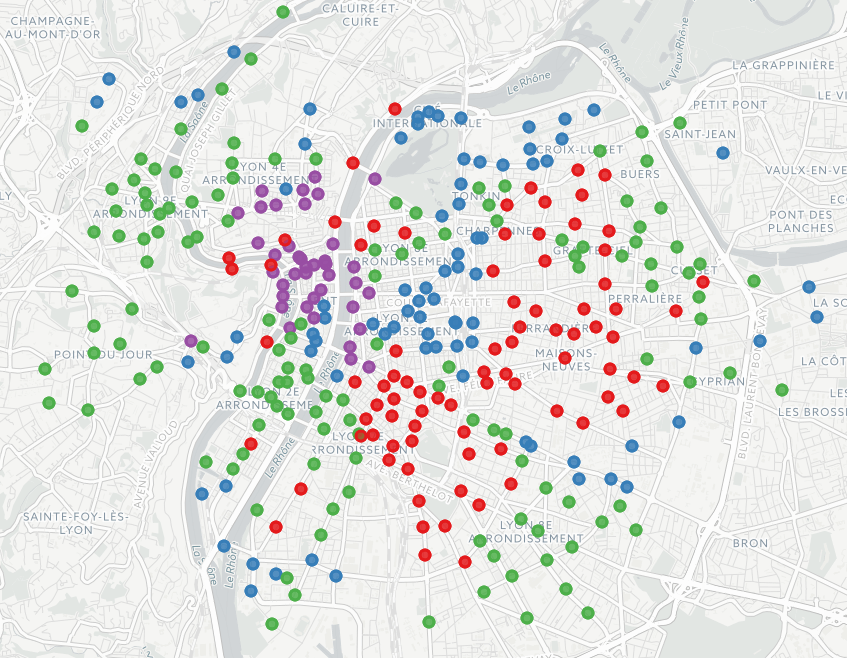
Figure 3: Clustered bike sharing in Lyon
On the second hand, results in Lyon are far more significant, from a geospatial point of view. Residential stations are mainly in Villeurbanne (east of Lyon) and in the 8th district (south east). We get a high concentration of blue stations (diurnal activities) in the 3rd district (Part-Dieu business area), or near La Doua campus (north). It is interesting to note the blue points in the far south east of the city: they correspond to the largest hospital in Lyon. If we consider purple stations (evening activities), almost all the points are located in the city center (Croix-Rousse, Lyon peninsula and riverbanks nearby), in partying places.
(… With all these elements, the true question is: where is Oslandia’s office in Lyon?)
In a next article, we will provide an extension of this work by predicting bike availability at stations.
If you are interested in continuing the discussion with us on this matter, or on another data-related topic, do not hesitate to mail us (infos+data@oslandia.com) or to explore our Github project! If you are interesting in reading about another clustering application, you can also find a previous OpenStreetMap-related work done with KMeans on our blog (see Github project here).
